NumPy: logspace() function
numpy.logspace() function
The logspace() function return numbers spaced evenly on a log scale.
In linear space, the sequence starts at base ** start (base to the power of start) and ends with base ** stop.
Syntax:
numpy.geomspace(start, stop, num=50, endpoint=True, dtype=None)
Version: 1.15.0
Parameter:
| Name | Description | Required / Optional |
|---|---|---|
| start | base ** start is the starting value of the sequence. | |
| stop | base ** stop is the final value of the sequence, unless endpoint is False. In that case, num + 1 values are spaced over the interval in log-space, of which all but the last (a sequence of length num) are returned. | |
| num | Number of samples to generate. Default is 50. | optional |
| endpoint | If True, stop is the last sample. Otherwise, it is not included. Default is True. | optional |
| base | The base of the log space. The step size between the elements in ln(samples) / ln(base) (or log_base(samples)) is uniform. Default is 10.0. | optional |
| dtype | The type of the output array. If dtype is not given, infer the data type from the other input arguments. |
Return value:
samples : ndarray - num samples, equally spaced on a log scale.
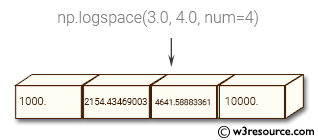
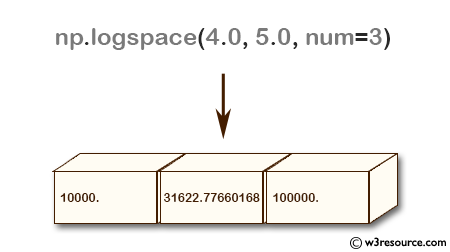
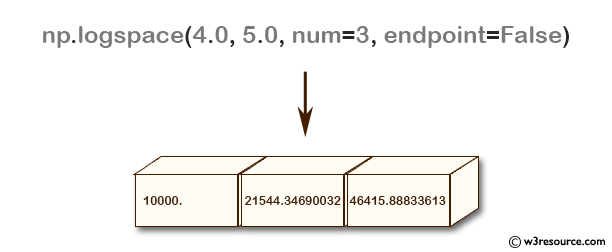
Example-1: NumPy.logspace() function
>>> import numpy as np
>>> np.logspace(4.0, 5.0, num=3)
array([  10000.        ,   31622.77660168,  100000.        ])
>>> np.logspace(4.0, 5.0, num=3, endpoint=False)
array([ 10000.        ,  21544.34690032,  46415.88833613])
>>> np.logspace(4.0, 5.0, num=3, base=2.0)
array([ 16.      ,  22.627417,  32.      ])
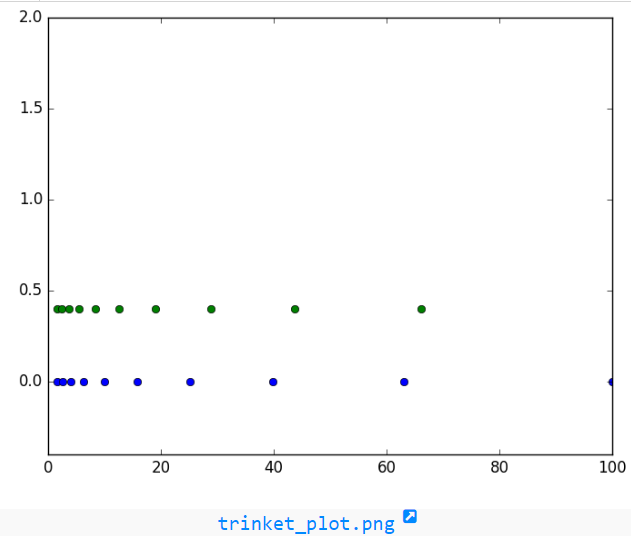
Pictorial Presentation:
Example-2: NumPy.logspace() function
>>> import numpy as np
>>> import matplotlib.pyplot as plt
>>> A=10
>>> a1=np.logspace(0.2, 2, A, endpoint=True)
>>> a2=np.logspace(0.2, 2, A, endpoint=False)
>>> b=np.zeros(A)
>>> plt.plot(a1, b, 'o')
[]
>>> plt.plot(a2, b + 0.4, 'o')
[]
>>> plt.ylim([-0.4, 2])
(-0.4, 2)
>>> plt.show()
numpy.logspace.plot show
Python - NumPy Code Editor:
Previous: linspace()
Next: geomspace()
- New Content published on w3resource:
- HTML-CSS Practical: Exercises, Practice, Solution
- Java Regular Expression: Exercises, Practice, Solution
- Scala Programming Exercises, Practice, Solution
- Python Itertools exercises
- Python Numpy exercises
- Python GeoPy Package exercises
- Python Pandas exercises
- Python nltk exercises
- Python BeautifulSoup exercises
- Form Template
- Composer - PHP Package Manager
- PHPUnit - PHP Testing
- Laravel - PHP Framework
- Angular - JavaScript Framework
- Vue - JavaScript Framework
- Jest - JavaScript Testing Framework