NumPy: geomspace() function
numpy.geomspace() function
The geomspace() function is used to get numbers spaced evenly on a log scale (a geometric progression).
This is similar to logspace, but with endpoints specified directly. Each output sample is a constant multiple of the previous.
Syntax:
numpy.geomspace(start, stop, num=50, endpoint=True, dtype=None)
Version: 1.15.0
Parameter:
| Name | Description | Required / Optional |
|---|---|---|
| start | The starting value of the sequence. | Required |
| stop | The final value of the sequence, unless endpoint is False. In that case, num + 1 values are spaced over the interval in log-space, of which all but the last (a sequence of length num) are returned. | Required |
| num | Number of samples to generate. Default is 50. | Optional |
| endpoint | If True, stop is the last sample. Otherwise, it is not included. Default is True. | Optional |
| dtype | The type of the output array. If dtype is not given, infer the data type from the other input arguments. |
Return value:
ndarray - num samples, equally spaced on a log scale.
Example-1: NumPy.geomspace() function
>>> import numpy as np
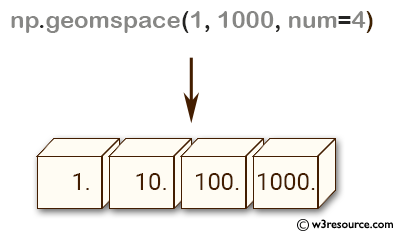
>>> np.geomspace(1, 1000, num=4)
array([ 1., 10., 100., 1000.])
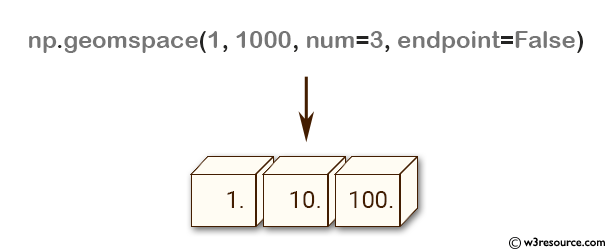
>>> np.geomspace(1, 1000, num=3, endpoint=False)
array([ 1., 10., 100.])
>>> np.geomspace(1, 1000, num=4, endpoint=False)
array([ 1. , 5.62341325, 31.6227766 , 177.827941 ])
>>> np.geomspace(1, 256, num=9)
array([ 1., 2., 4., 8., 16., 32., 64., 128., 256.])
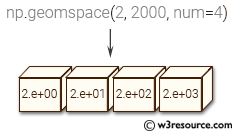
Pictorial Presentation:
Example-2: NumPy.geomspace() method
>>> import numpy as np
>>> import matplotlib.pyplot as plt
>>> N = 10
>>> y = np.zeros(N)
>>> plt.semilogx(np.geomspace(1, 1000, N, endpoint=True), y + 1, 'o')
>>> plt.semilogx(np.geomspace(1, 1000, N, endpoint=False), y + 2, 'o')
>>> plt.axis([0.5, 2000, 0, 3])
>>> plt.grid(True, color='0.7', linestyle='-', which='both', axis='both')
>>> plt.show()
Python - NumPy Code Editor:
Previous: logspace()
Next: meshgrid()
- New Content published on w3resource:
- HTML-CSS Practical: Exercises, Practice, Solution
- Java Regular Expression: Exercises, Practice, Solution
- Scala Programming Exercises, Practice, Solution
- Python Itertools exercises
- Python Numpy exercises
- Python GeoPy Package exercises
- Python Pandas exercises
- Python nltk exercises
- Python BeautifulSoup exercises
- Form Template
- Composer - PHP Package Manager
- PHPUnit - PHP Testing
- Laravel - PHP Framework
- Angular - JavaScript Framework
- Vue - JavaScript Framework
- Jest - JavaScript Testing Framework