NumPy: linspace() function
numpy.linspace() function
The linspace() function returns evenly spaced numbers over a specified interval [start, stop].
The endpoint of the interval can optionally be excluded.
Syntax:
numpy.linspace(start, stop, num=50, endpoint=True, retstep=False, dtype=None)
Version: 1.15.0
Parameter:
| Name | Description | Required / Optional |
|---|---|---|
| start | The starting value of the sequence. | Required |
| stop | The end value of the sequence, unless endpoint is set to False. In that case, the sequence consists of all but the last of num + 1 evenly spaced samples, so that stop is excluded. Note that the step size changes when endpoint is False. | Required |
| num | Number of samples to generate. Default is 50. Must be non-negative. | Optional |
| endpoint | If True, stop is the last sample. Otherwise, it is not included. Default is True. | Optional |
| retstep | If True, return (samples, step), where step is the spacing between samples. | Optional |
| dtype | The type of the output array. If dtype is not given, infer the data type from the other input arguments. New in version 1.9.0. |
Optional |
Return value:
ndarray - There are num equally spaced samples in the closed interval [start, stop] or the half-open interval [start, stop) (depending on whether endpoint is True or False).
step : float, optional - Only returned if retstep is True
Size of spacing between samples.
Example-1: NumPy.linspace() method
>>> import numpy as np
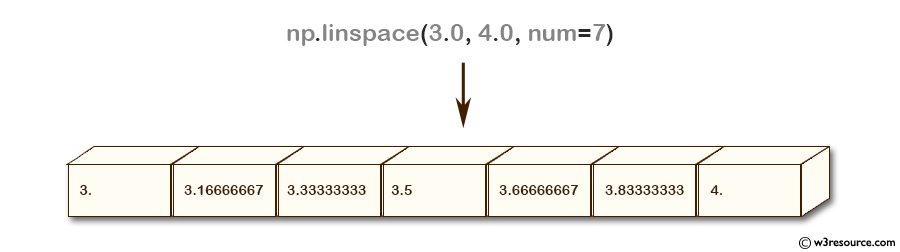
>>> np.linspace(3.0, 4.0, num=7)
array([ 3. , 3.16666667, 3.33333333, 3.5 , 3.66666667,
3.83333333, 4. ])
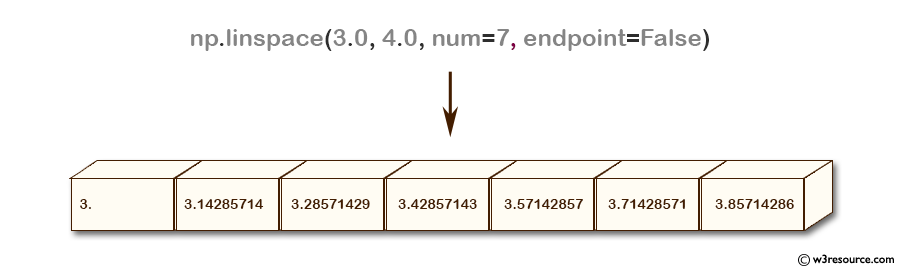
>>> np.linspace(3.0,4.0, num=7, endpoint=False)
array([ 3. , 3.14285714, 3.28571429, 3.42857143, 3.57142857,
3.71428571, 3.85714286])
>>> np.linspace(3.0,4.0, num=7, retstep=True)
(array([ 3. , 3.16666667, 3.33333333, 3.5 , 3.66666667,
3.83333333, 4. ]), 0.16666666666666666)
Pictorial Presentation:
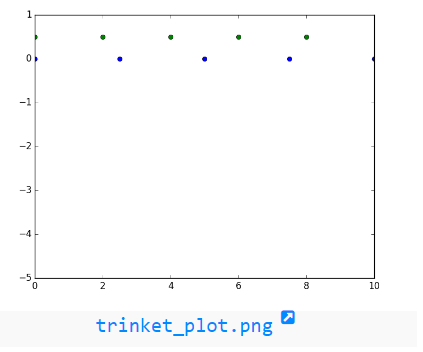
Example-2: NumPy.linspace() method
>>> import numpy as np
>>> import matplotlib.pyplot as plt
>>> A = 5
>>> x = np.zeros(A)
>>> a1 = np.linspace(0, 10, A, endpoint=True)
>>> a2 = np.linspace(0, 10, A, endpoint=False)
>>> plt.plot(a1, x, 'o')
[<matplotlib.lines.Line2D object at 0x7f3d13a48080>]
>>> plt.plot(a2, x + 0.5, 'o')
[<matplotlib.lines.Line2D object at 0x7f3d1b582438>]
>>> plt.ylim([-5.0, 1])
(-5.0, 1)
>>> plt.show()
numpy.linspace.plot show
Python - NumPy Code Editor:
Previous: arange()
Next: logspace()
- New Content published on w3resource:
- HTML-CSS Practical: Exercises, Practice, Solution
- Java Regular Expression: Exercises, Practice, Solution
- Scala Programming Exercises, Practice, Solution
- Python Itertools exercises
- Python Numpy exercises
- Python GeoPy Package exercises
- Python Pandas exercises
- Python nltk exercises
- Python BeautifulSoup exercises
- Form Template
- Composer - PHP Package Manager
- PHPUnit - PHP Testing
- Laravel - PHP Framework
- Angular - JavaScript Framework
- Vue - JavaScript Framework
- Jest - JavaScript Testing Framework