Matplotlib Basic: - Exercises, Practice, Solution
Matplotlib Basic [15 exercises with solution]
[An editor is available at the bottom of the page to write and execute the scripts.]
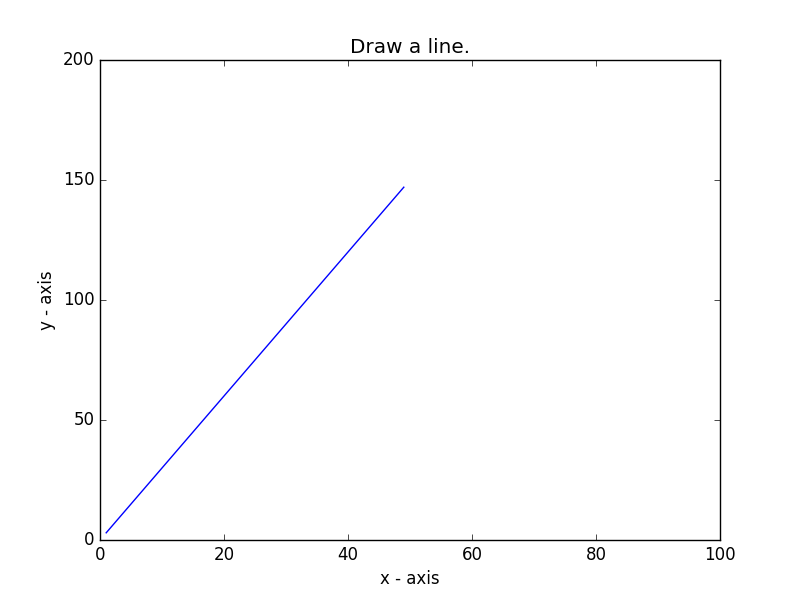
1. Write a Python program to draw a line with suitable label in the x axis, y axis and a title. Go to the editor
The code snippet gives the output shown in the following screenshot:
Click me to see the sample solution
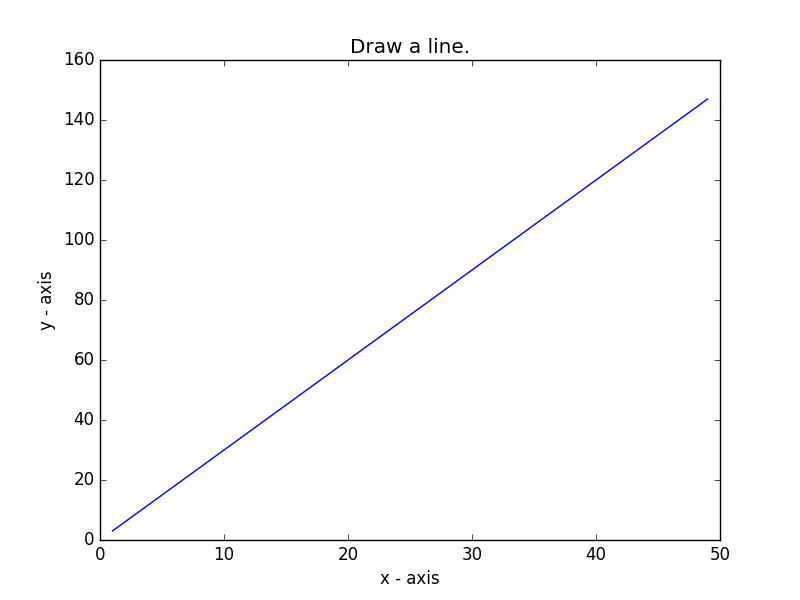
2. Write a Python program to draw a line using given axis values with suitable label in the x axis , y axis and a title. Go to the editor
The code snippet gives the output shown in the following screenshot:
Click me to see the sample solution
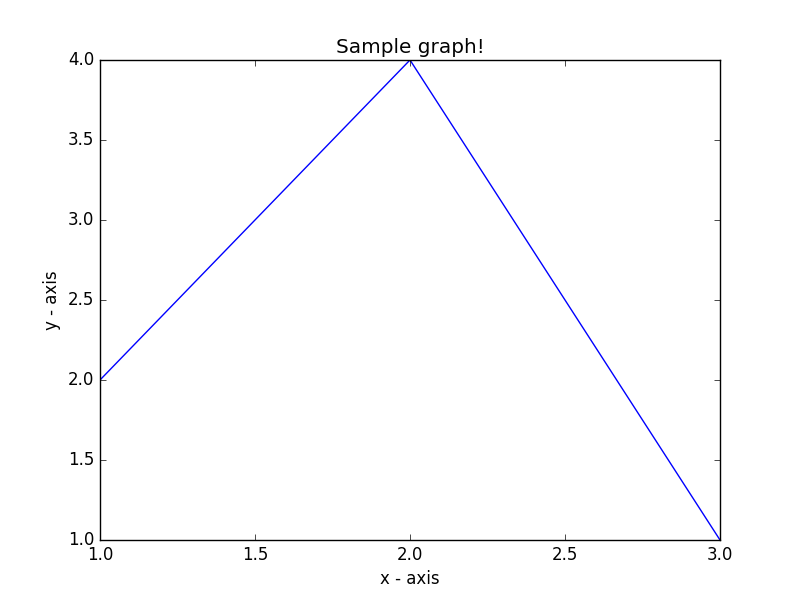
3. Write a Python program to draw a line using given axis values taken from a text file, with suitable label in the x axis, y axis and a title. Go to the editor
Test Data:
test.txt
1 2
2 4
3 1
The code snippet gives the output shown in the following screenshot:

Click me to see the sample solution
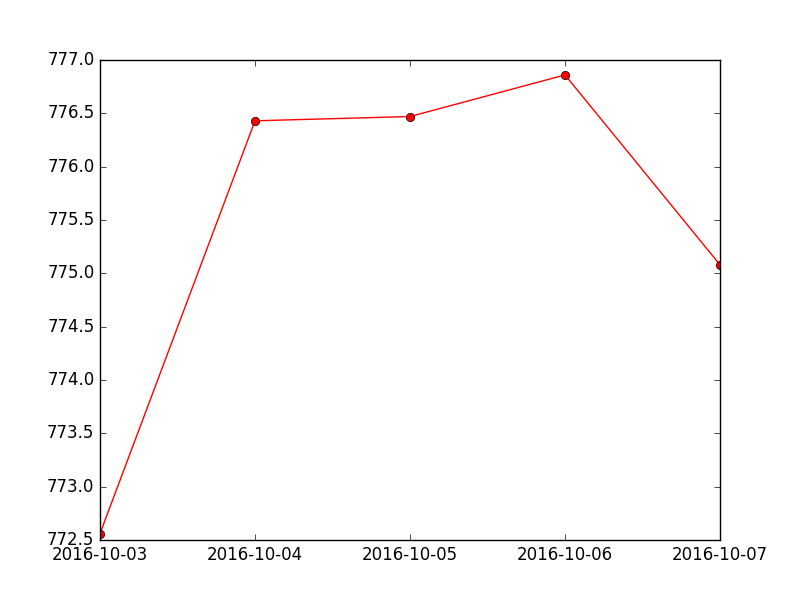
4. Write a Python program to draw line charts of the financial data of Alphabet Inc. between October 3, 2016 to October 7, 2016. Go to the editor
Sample Financial data (fdata.csv):
Date,Open,High,Low,Close
10-03-16,774.25,776.065002,769.5,772.559998
10-04-16,776.030029,778.710022,772.890015,776.429993
10-05-16,779.309998,782.070007,775.650024,776.469971
10-06-16,779,780.47998,775.539978,776.859985
10-07-16,779.659973,779.659973,770.75,775.080017
The code snippet gives the output shown in the following screenshot:
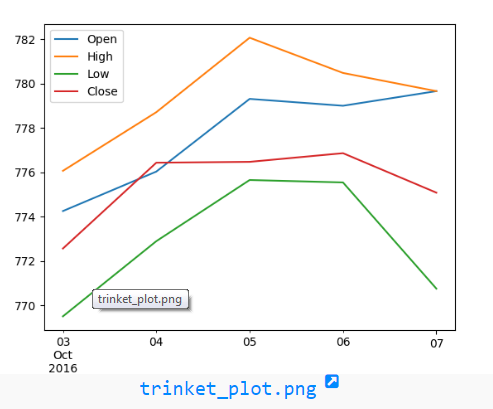
Click me to see the sample solution
5. Write a Python program to plot two or more lines on same plot with suitable legends of each line.
Go to the editor
The code snippet gives the output shown in the following screenshot:
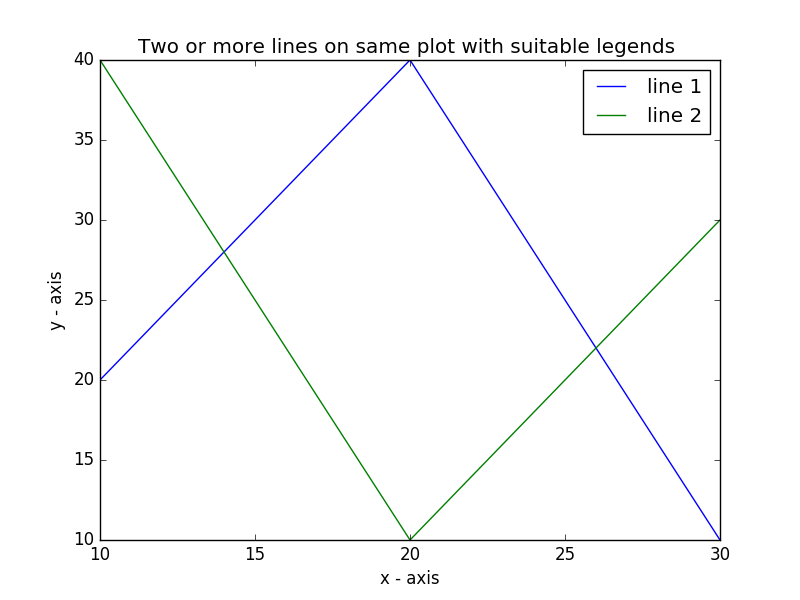
Click me to see the sample solution
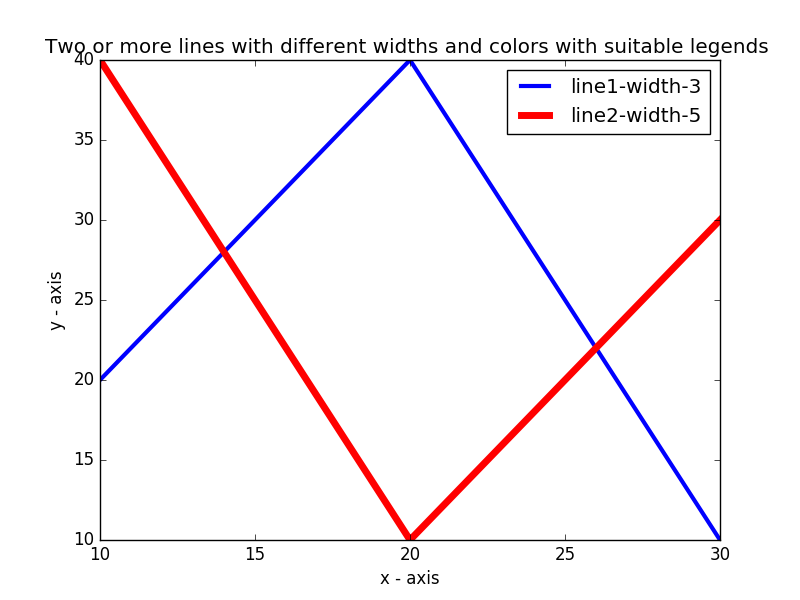
6. Write a Python program to plot two or more lines with legends, different widths and colors. Go to the editor
The code snippet gives the output shown in the following screenshot:
Click me to see the sample solution
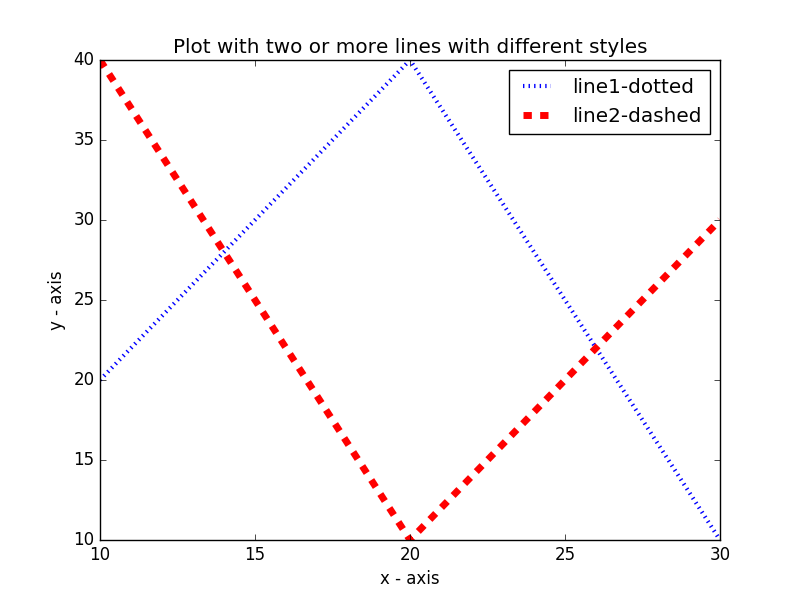
7. Write a Python program to plot two or more lines with different styles. Go to the editor
The code snippet gives the output shown in the following screenshot:
Click me to see the sample solution
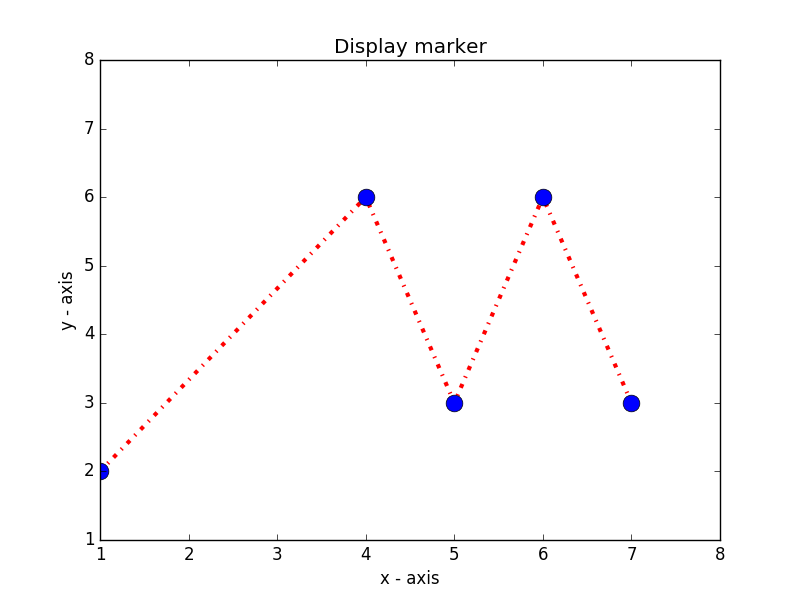
8. Write a Python program to plot two or more lines and set the line markers. Go to the editor
The code snippet gives the output shown in the following screenshot:
Click me to see the sample solution
9. Write a Python program to display the current axis limits values and set new axis values. Go to the editor
The code snippet gives the output shown in the following screenshot:
Click me to see the sample solution
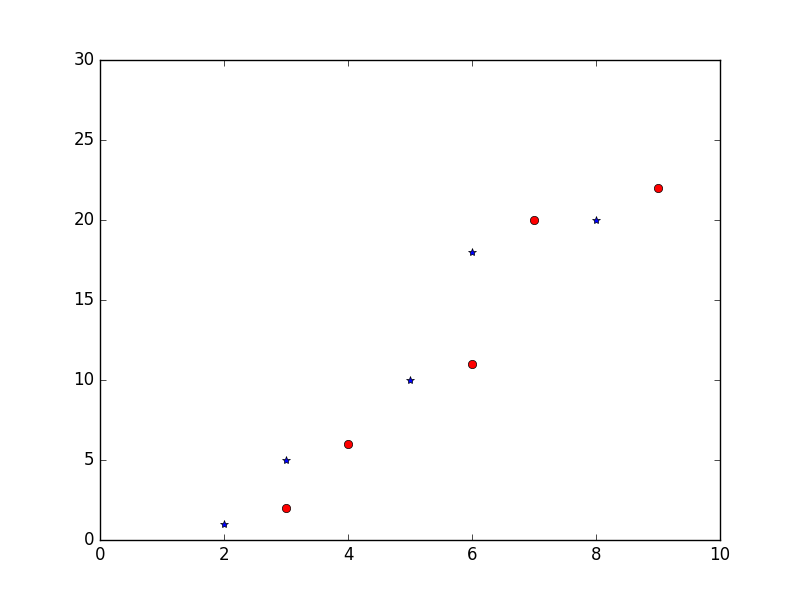
10. Write a Python program to plot quantities which have an x and y position.
Go to the editor
The code snippet gives the output shown in the following screenshot:
Click me to see the sample solution
11. Write a Python program to plot several lines with different format styles in one command using arrays.
Go to the editor
The code snippet gives the output shown in the following screenshot:

Click me to see the sample solution
12. Write a Python program to create multiple types of charts (a simple curve and plot some quantities) on a single set of axes. Go to the editor
The code snippet gives the output shown in the following screenshot:
Click me to see the sample solution
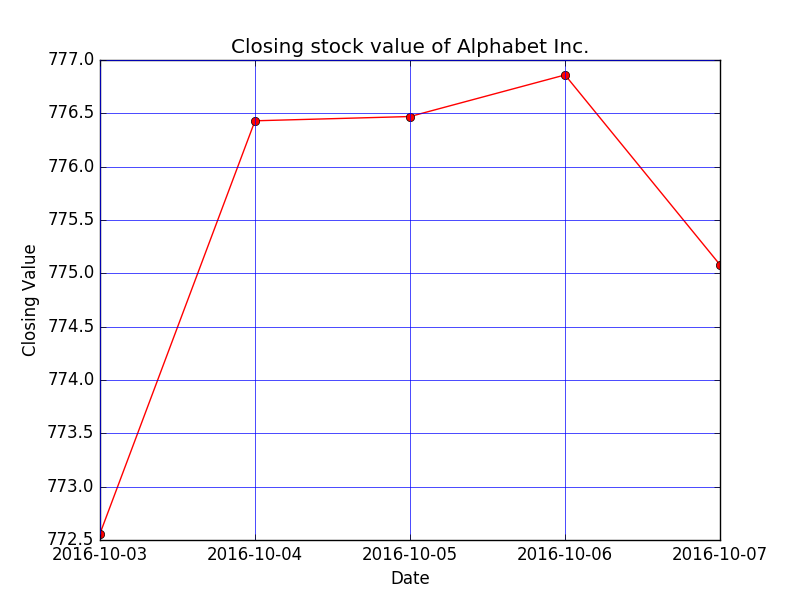
13. Write a Python program to display the grid and draw line charts of the closing value of Alphabet Inc. between October 3, 2016 to October 7, 2016. Customized the grid lines with linestyle -, width .5. and color blue.Go to the editor
Date,Close
03-10-16,772.559998
04-10-16,776.429993
05-10-16,776.469971
06-10-16,776.859985
07-10-16,775.080017
The code snippet gives the output shown in the following screenshot:
Click me to see the sample solution
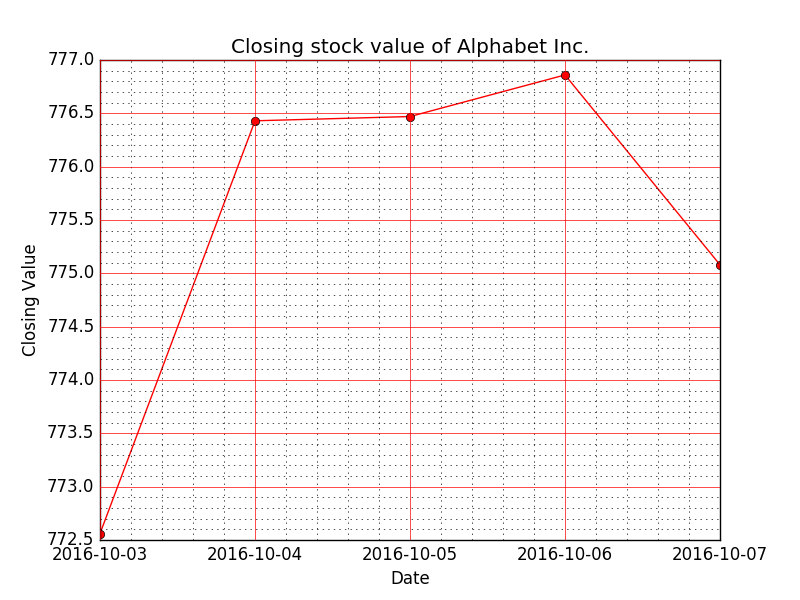
14. Write a Python program to display the grid and draw line charts of the closing value of Alphabet Inc. between October 3, 2016 to October 7, 2016. Customized the grid lines with rendering with a larger grid (major grid) and a smaller grid (minor grid).Turn on the grid but turn off ticks. Go to the editor
The code snippet gives the output shown in the following screenshot:
Click me to see the sample solution
15. Write a Python program to create multiple plots. Go to the editor
The code snippet gives the output shown in the following screenshot:
Click me to see the sample solution
Python Code Editor:
More to Come !
Do not submit any solution of the above exercises at here, if you want to contribute go to the appropriate exercise page.
- New Content published on w3resource:
- HTML-CSS Practical: Exercises, Practice, Solution
- Java Regular Expression: Exercises, Practice, Solution
- Scala Programming Exercises, Practice, Solution
- Python Itertools exercises
- Python Numpy exercises
- Python GeoPy Package exercises
- Python Pandas exercises
- Python nltk exercises
- Python BeautifulSoup exercises
- Form Template
- Composer - PHP Package Manager
- PHPUnit - PHP Testing
- Laravel - PHP Framework
- Angular - JavaScript Framework
- Vue - JavaScript Framework
- Jest - JavaScript Testing Framework