Matplotlib Basic: Draw a line using given axis values taken from a text file, with suitable label in the x axis, y axis and a title
Matplotlib Basic: Exercise-3 with Solution
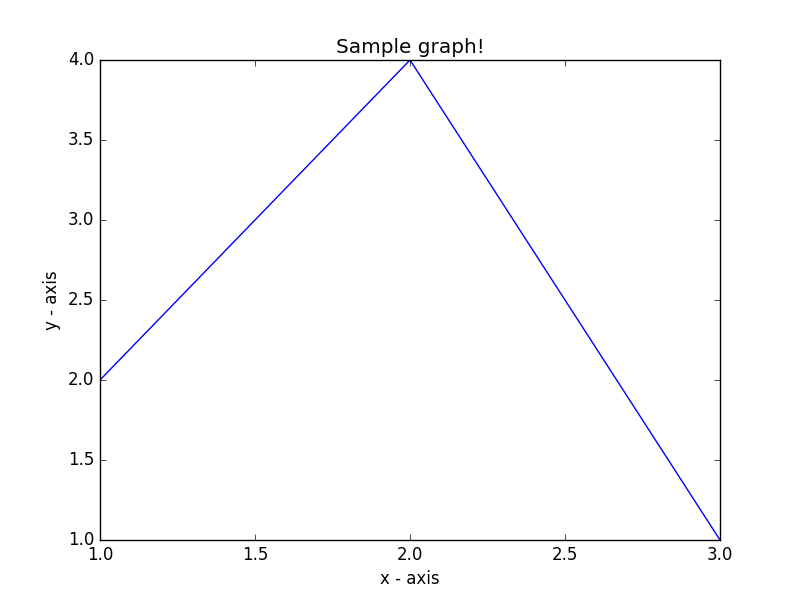
Write a Python program to draw a line using given axis values with suitable label in the x axis , y axis and a title.
test.txt
1 2
2 4
3 1
Sample Solution:
Python Code:
import matplotlib.pyplot as plt
with open("test.txt") as f:
    data = f.read()
data = data.split('\n')
x = [row.split(' ')[0] for row in data]
y = [row.split(' ')[1] for row in data]
plt.plot(x, y)
# Set the x axis label of the current axis.
plt.xlabel('x - axis')
# Set the y axis label of the current axis.
plt.ylabel('y - axis')
# Set a title
plt.title('Sample graph!')
# Display a figure.
plt.show()
Sample Output:
Python Code Editor:
Contribute your code and comments through Disqus.
Previous: Write a Python program to draw a line using given axis values with suitable label in the x axis , y axis and a title.
Next: Write a Python program to draw line charts of the financial data of Alphabet Inc. between October 3, 2016 to October 7, 2016.
What is the difficulty level of this exercise?
- New Content published on w3resource:
- HTML-CSS Practical: Exercises, Practice, Solution
- Java Regular Expression: Exercises, Practice, Solution
- Scala Programming Exercises, Practice, Solution
- Python Itertools exercises
- Python Numpy exercises
- Python GeoPy Package exercises
- Python Pandas exercises
- Python nltk exercises
- Python BeautifulSoup exercises
- Form Template
- Composer - PHP Package Manager
- PHPUnit - PHP Testing
- Laravel - PHP Framework
- Angular - JavaScript Framework
- Vue - JavaScript Framework
- Jest - JavaScript Testing Framework