Matplotlib Basic: Display the current axis limits values and set new axis values
Matplotlib Basic: Exercise-9 with Solution
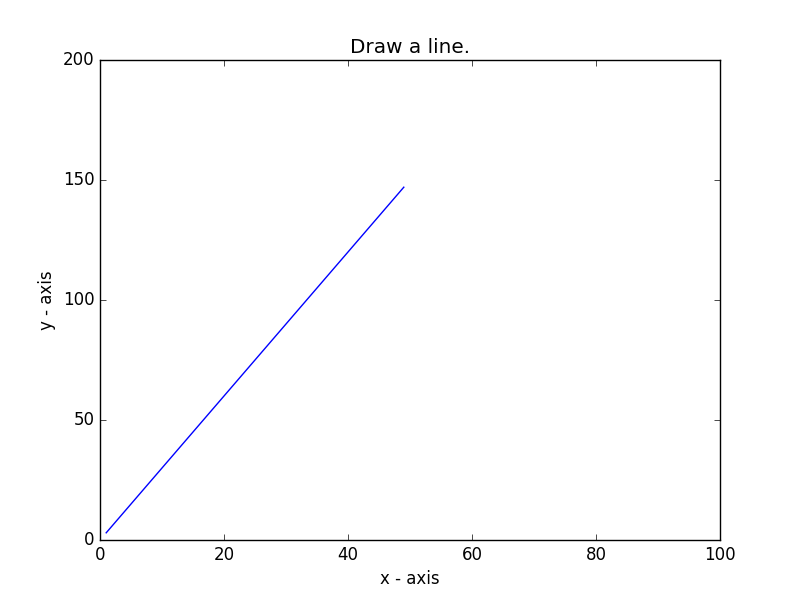
Write a Python program to display the current axis limits values and set new axis values.
Sample Solution:
Python Code:
import matplotlib.pyplot as plt
X = range(1, 50)
Y = [value * 3 for value in X]
plt.plot(X, Y)
plt.xlabel('x - axis')
plt.ylabel('y - axis')
plt.title('Draw a line.')
# shows the current axis limits values
print(plt.axis())
# set new axes limits
# Limit of x axis 0 to 100
# Limit of y axis 0 to 200
plt.axis([0, 100, 0, 200])
# Display the figure.
plt.show()
Sample Output:
Python Code Editor:
Contribute your code and comments through Disqus.
Previous: Write a Python program to plot two or more lines and set the line markers.
Next: Write a Python program to plot quantities which have an x and y position.
What is the difficulty level of this exercise?
- New Content published on w3resource:
- HTML-CSS Practical: Exercises, Practice, Solution
- Java Regular Expression: Exercises, Practice, Solution
- Scala Programming Exercises, Practice, Solution
- Python Itertools exercises
- Python Numpy exercises
- Python GeoPy Package exercises
- Python Pandas exercises
- Python nltk exercises
- Python BeautifulSoup exercises
- Form Template
- Composer - PHP Package Manager
- PHPUnit - PHP Testing
- Laravel - PHP Framework
- Angular - JavaScript Framework
- Vue - JavaScript Framework
- Jest - JavaScript Testing Framework