Matplotlib Basic: Plot two or more lines and set the line markers
Matplotlib Basic: Exercise-8 with Solution
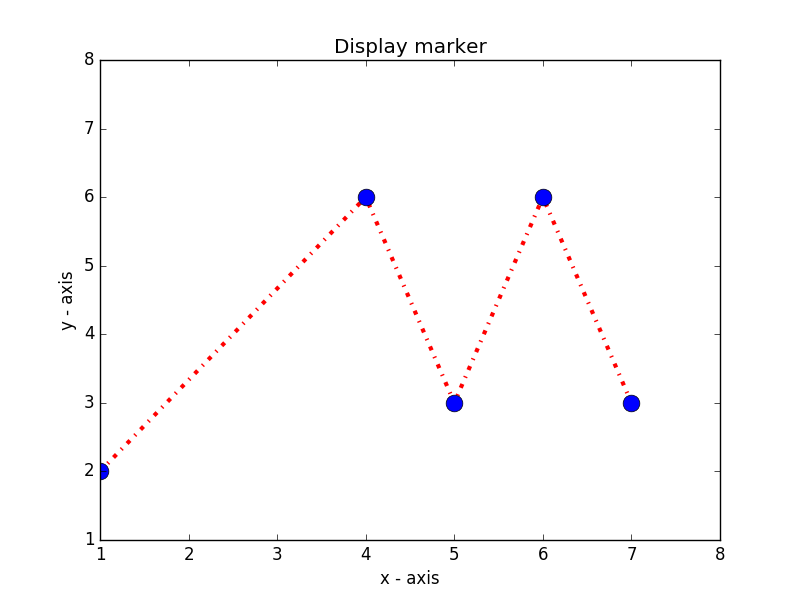
Write a Python program to plot two or more lines and set the line markers.
Sample Solution:
Python Code:
import matplotlib.pyplot as plt
# x axis values
x = [1,4,5,6,7]
# y axis values
y = [2,6,3,6,3]

# plotting the points
plt.plot(x, y, color='red', linestyle='dashdot', linewidth = 3,
         marker='o', markerfacecolor='blue', markersize=12)
#Set the y-limits of the current axes.
plt.ylim(1,8)
#Set the x-limits of the current axes.
plt.xlim(1,8)

# naming the x axis
plt.xlabel('x - axis')
# naming the y axis
plt.ylabel('y - axis')

# giving a title to my graph
plt.title('Display marker')
# function to show the plot
plt.show()
Sample Output:
Python Code Editor:
Contribute your code and comments through Disqus.
Previous: Write a Python program to plot two or more lines with different styles.
Next: Write a Python program to display the current axis limits values and set new axis values.
What is the difficulty level of this exercise?
- New Content published on w3resource:
- HTML-CSS Practical: Exercises, Practice, Solution
- Java Regular Expression: Exercises, Practice, Solution
- Scala Programming Exercises, Practice, Solution
- Python Itertools exercises
- Python Numpy exercises
- Python GeoPy Package exercises
- Python Pandas exercises
- Python nltk exercises
- Python BeautifulSoup exercises
- Form Template
- Composer - PHP Package Manager
- PHPUnit - PHP Testing
- Laravel - PHP Framework
- Angular - JavaScript Framework
- Vue - JavaScript Framework
- Jest - JavaScript Testing Framework