Matplotlib Basic: Plot quantities which have an x and y position
Matplotlib Basic: Exercise-10 with Solution
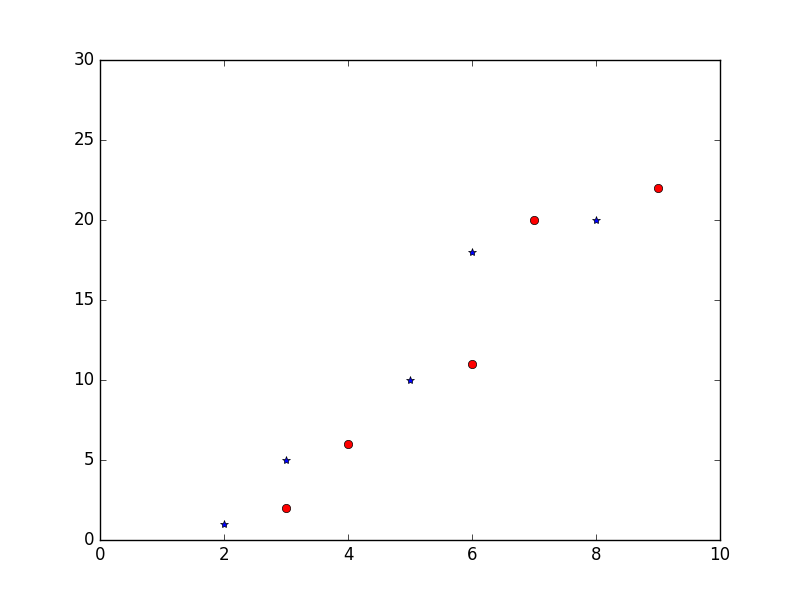
Write a Python program to plot quantities which have an x and y position.
Sample Solution:
Python Code:
import numpy as np
import pylab as pl
# Make an array of x values
x1 = [2, 3, 5, 6, 8]
# Make an array of y values for each x value
y1 = [1, 5, 10, 18, 20]
# Make an array of x values
x2 = [3, 4, 6, 7, 9]
# Make an array of y values for each x value
y2 = [2, 6, 11, 20, 22]
# set new axes limits
pl.axis([0, 10, 0, 30])
# use pylab to plot x and y as red circles
pl.plot(x1, y1,'b*', x2, y2, 'ro')
# show the plot on the screen
pl.show()
Sample Output:
Python Code Editor:
Contribute your code and comments through Disqus.
Previous: Write a Python program to display the current axis limits values and set new axis values.
Next: Write a Python program to plot several lines with different format styles in one command using arrays.
What is the difficulty level of this exercise?
- New Content published on w3resource:
- HTML-CSS Practical: Exercises, Practice, Solution
- Java Regular Expression: Exercises, Practice, Solution
- Scala Programming Exercises, Practice, Solution
- Python Itertools exercises
- Python Numpy exercises
- Python GeoPy Package exercises
- Python Pandas exercises
- Python nltk exercises
- Python BeautifulSoup exercises
- Form Template
- Composer - PHP Package Manager
- PHPUnit - PHP Testing
- Laravel - PHP Framework
- Angular - JavaScript Framework
- Vue - JavaScript Framework
- Jest - JavaScript Testing Framework