Matplotlib Basic: Draw line charts of the financial data of Alphabet Inc. between October 3, 2016 to October 7, 2016
Matplotlib Basic: Exercise-4 with Solution
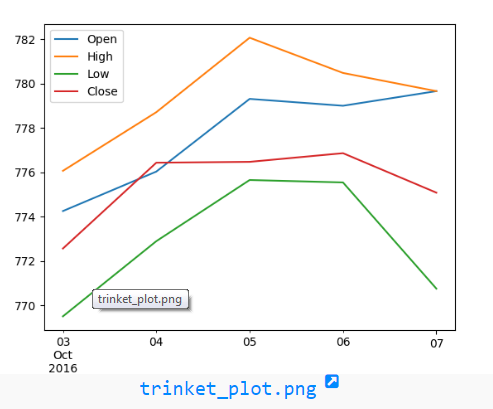
Write a Python program to draw line charts of the financial data of Alphabet Inc. between October 3, 2016 to October 7, 2016.
Sample Financial data (fdata.csv):
Date,Open,High,Low,Close
10-03-16,774.25,776.065002,769.5,772.559998
10-04-16,776.030029,778.710022,772.890015,776.429993
10-05-16,779.309998,782.070007,775.650024,776.469971
10-06-16,779,780.47998,775.539978,776.859985
10-07-16,779.659973,779.659973,770.75,775.080017
Sample Solution:
Python Code:
import matplotlib.pyplot as plt
import pandas as pd
df = pd.read_csv('fdata.csv', sep=',', parse_dates=True, index_col=0)
df.plot()
plt.show()
Sample Output:
Python Code Editor:
Contribute your code and comments through Disqus.
- New Content published on w3resource:
- HTML-CSS Practical: Exercises, Practice, Solution
- Java Regular Expression: Exercises, Practice, Solution
- Scala Programming Exercises, Practice, Solution
- Python Itertools exercises
- Python Numpy exercises
- Python GeoPy Package exercises
- Python Pandas exercises
- Python nltk exercises
- Python BeautifulSoup exercises
- Form Template
- Composer - PHP Package Manager
- PHPUnit - PHP Testing
- Laravel - PHP Framework
- Angular - JavaScript Framework
- Vue - JavaScript Framework
- Jest - JavaScript Testing Framework