Integrating Graph Manager with Slack
Apollo Graph Manager can send notifications about your data graph to your team's Slack workspace. This helps you stay up to date on changes to your graph's schema and performance as soon as they occur.
These notifications include:
- Daily reports of your graph's request rate, error rate, and latency
- Schema change notifications whenever your graph's schema is updated
- Performance alerts whenever a metric such as error percentage or request latency exceeds a particular threshold (this feature requires a paid plan)
Setup
To set up Slack notifications, you first configure an incoming webhook in Slack, then provide that webhook's URL to Graph Manager.
1. Create an incoming webhook
To create an incoming webhook:
- From the Incoming WebHooks page of the Slack App Directory, sign in and click Add to Slack.
- Select the channel that should receive Graph Manager notifications and click Add Incoming WebHooks integration.
- Copy the Webhook URL (has the format https://hooks.slack.com/services/...) for use in the next step.
You can repeat this process to create webhook URLs for multiple channels.
2. Provide the webhook to Graph Manager
From the Graph Manager UI:
- Select the graph you want to configure Slack notifications for.
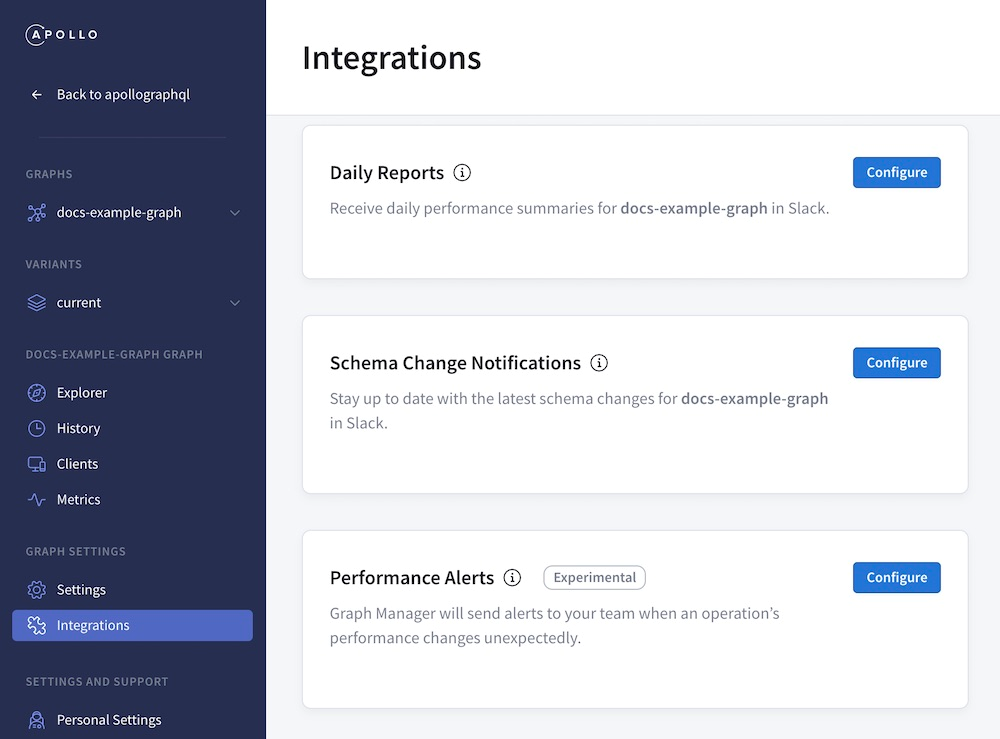
- Open the graph's Integrations page in the left nav.
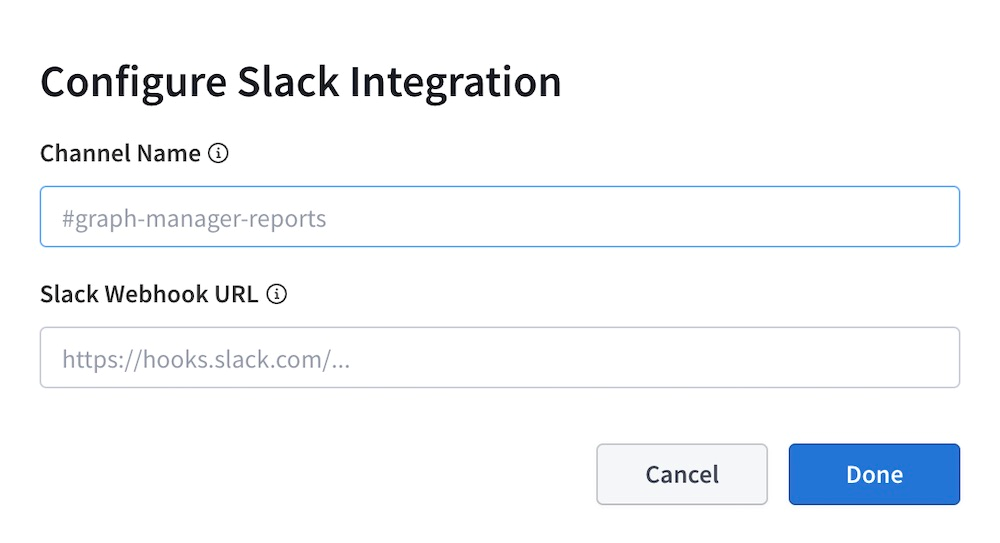
- In the Reporting Channels section at the bottom of the Integrations page, click Configure Slack Channel. The following dialog appears:
- Specify the name of the Slack channel you want to push notifications to.
- In the Slack Webhook URL field, paste the webhook URL you obtained in Create an incoming webhook.
- Click Done.
- Verify that your selected Slack channel receives a confirmation notification from Graph Manager.
To configure notifications for multiple Slack channels, repeat this process with a different corresponding webhook URL each time.
3. Configure individual notification types
After you provide at least one Slack webhook to Graph Manager, you can configure individual notification types from the other sections of your graph's Integrations page:
Daily reports
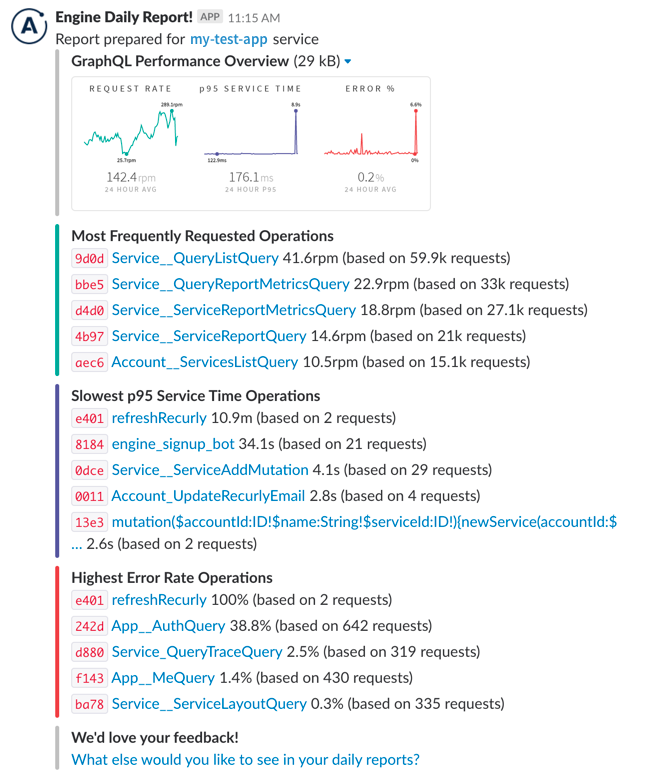
Graph Manager sends your graph's daily report around 9am in your specified time zone. The report provides a high-level summary of what your GraphQL API delivered in the previous day:
Acting on report data
The daily report provides an actionable summary of what's happened in your API over the last 24 hours. Here?s how you can use it to identify issues:
- Request rate: This shows you how many queries are hitting your server every minute, along with a list of the most popular operations. If you see a significant dip in this value, it might mean that queries aren?t able to reach your server, or that a particular client is down.
- p95 service time: An operation's p95 response time indicates that 95% of that operation's executions complete faster than the reported value. You can use this to identify that your API is overloaded and users are seeing long loading delays, or to find out which queries are taking the longest to run. This is often connected to UI performance, so a 500ms query probably means some part of your UI is taking that long to display.
- Error percentage: This shows you how many of your GraphQL requests produce an error result, along with a list of the operations with the highest error percentage. Spikes in errors might be the result of an underlying back-end malfunction.
Schema change notifications
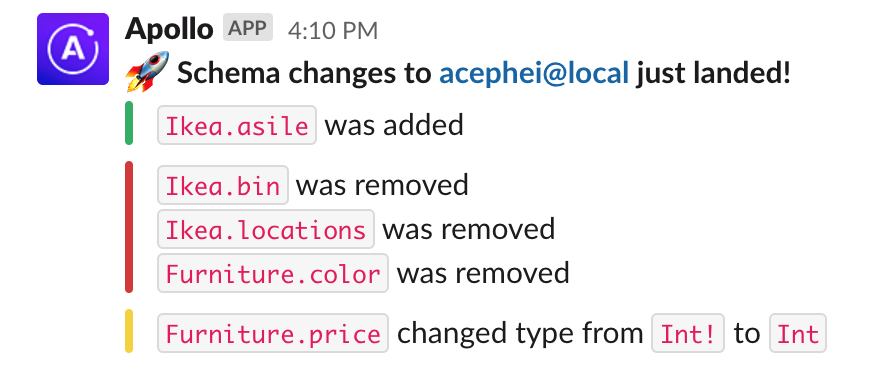
Graph Manager can notify your Slack channel whenever any changes (additions, deprecations, removals, etc.) are made to your graph's registered schema:
You can configure separate change notifications for each variant of your graph.
Performance alerts
Performance alerts require a paid plan. They are currently experimental.
Graph Manager can notify you whenever a particular metric (such as error rate) for a particular GraphQL operation exceeds a defined threshold. This is useful for detecting anomalies, especially following a release.
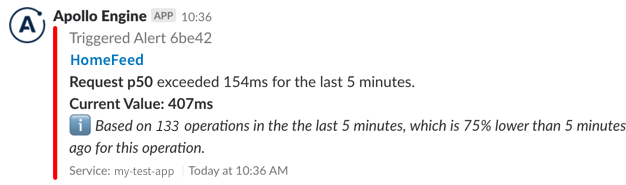
Supported metrics
You can configure performance alerts for any of the following metrics:
- Request rate: requests per minute
- Request duration: p50/p95/p99 service time
- Error rate: errors per minute
- Error percentage: the number of requests with errors, divided by total requests
Each performance alert you define can apply to either a specific operation or any operation. If you define an alert that applies to a specific operation, "any operation" alerts for the same metric no longer apply to that operation (i.e., the more specific alert takes precedence).
Measuring thresholds
Thresholds are measured against a rolling five-minute window. For example, let's say you configure an alert to trigger when an operation's error rate exceeds 5%. If 6 out of 100 executions of that operation result in an error during a five-minute period, the alert will trigger with an error rate of 6%. When the error rate falls back below 5%, your notification will resolve.
Previous: Integrating Graph Manager with GitHub
- New Content published on w3resource:
- HTML-CSS Practical: Exercises, Practice, Solution
- Java Regular Expression: Exercises, Practice, Solution
- Scala Programming Exercises, Practice, Solution
- Python Itertools exercises
- Python Numpy exercises
- Python GeoPy Package exercises
- Python Pandas exercises
- Python nltk exercises
- Python BeautifulSoup exercises
- Form Template
- Composer - PHP Package Manager
- PHPUnit - PHP Testing
- Laravel - PHP Framework
- Angular - JavaScript Framework
- Vue - JavaScript Framework
- Jest - JavaScript Testing Framework