Analyzing performance
Apollo includes a performance monitoring system which, through a single line of configuration, brings insights about the queries being executed against your graph, the fields being used in your graph, the clients making requests against your graph, how long your requests are taking, and more.
From that information it is possible to track down slow or frequently erroring resolvers, clients using deprecated fields, queries from native apps that need to be supported indefinitely, resolvers that are executing in series instead of in parallel, for example.
How it works
With one line of configuration, Apollo Server will start recording traces of every request it receives and sending summaries of that performance data to Graph Manager. Graph Manager aggregates and summarizes those traces to provide segmented, filterable insights about your graph's usage.
Traces
With the metrics reporting set up, you'll be able to see traces of your operations in Graph Manager. Execution of a GraphQL request happens layer by layer, and each field in the query calls a function in your server called a resolver. The trace view in Graph Manager allows you to look at a detailed breakdown of the execution for individual operations, with timing shown for every resolver.
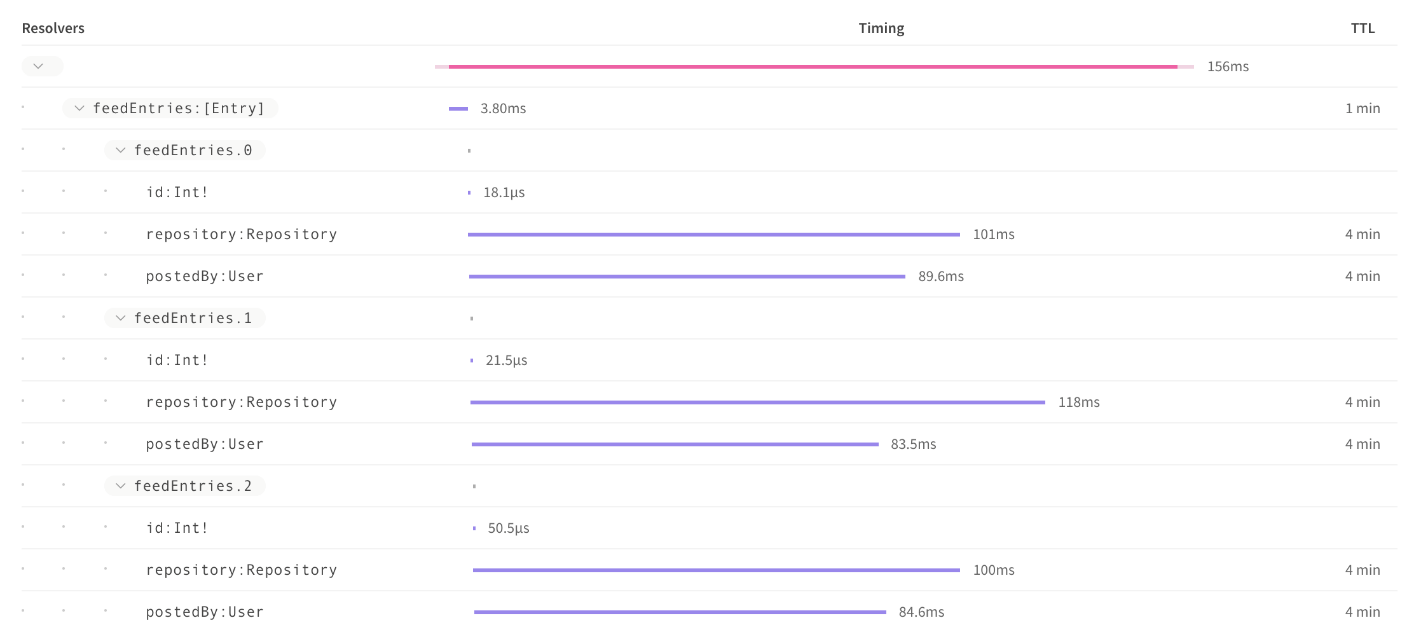
Critical path
When a trace is opened, some resolvers are collapsed and others are expanded. This is Graph Manager automatically expanding resolvers on the "critical path" of the query. The critical path is the set of fields and resolvers that makes the longest sequence in the query. If you are trying to speed up your query's execution, this is the set of fields you should be looking at first.
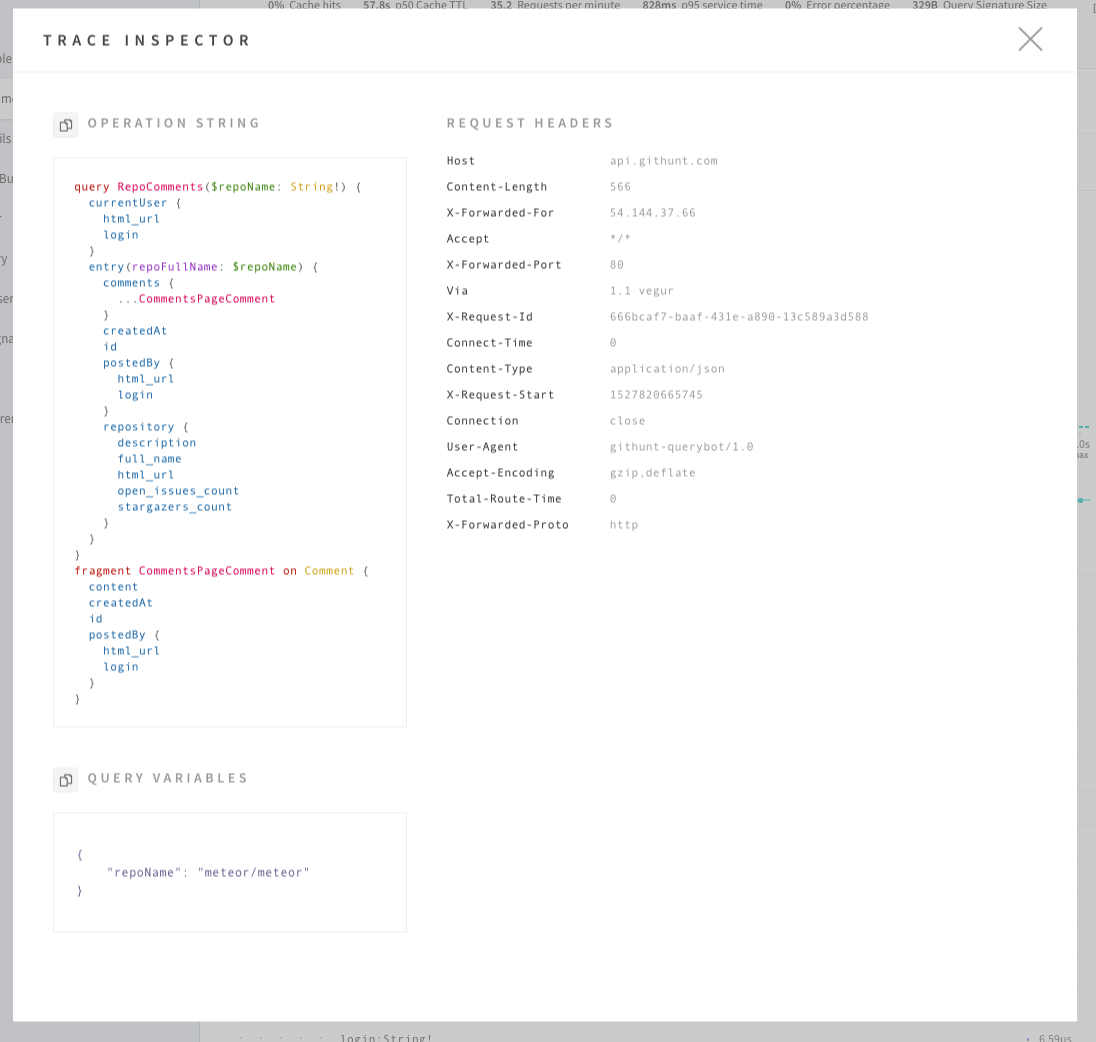
Trace inspector
Every trace stored in Graph Manager records the request's resolver timings, variables, and HTTP headers. This is particularly useful when debugging and the detailed information about the trace can be found by opening up the trace inspector:
A note on GraphQL subscriptions
Graph Manager does not currently track statistics or traces for subscriptions. The proxy does, however, support the transparent pass-through of subscription requests and responses.
Operation signatures
Graph Manager groups operations that select the same fields together, treating different queries distinctly even if they share the same name. Not every query string can be taken as-is for grouping though, because some queries inline their variables. For these cases, Graph Manager has a signature algorithm to normalize inline variables so that queries of the same shape can still be grouped together.
Signature algorithm
The current signature algorithm performs the following transformations when generating a signature. (Future improvements to Graph Manager will allow users to customize the signature algorithm.)
- Input argument values are mapped according to the following rules:
- Variable, BooleanValue, and EnumValue preserved
- IntValue and FloatValue replaced by 0
- StringValue replaced by ""
- ListValue replaced by []
- ObjectValue replaced by {}
- Ignored tokens are removed, including redundant WhiteSpace. Single spaces are only preserved when required for parsing the request.
- Only the OperationDefinition corresponding to the requested operation and reachable FragmentDefinitions are included. The operation appears first. Fragment definitions appear in order of first reachability when traversing spread-first, depth-second.
- Aliases are removed.
- In SelectionSet, fields appear before fragment spreads, fragment spreads appear before inline fragments.
- Otherwise, elements are sorted by name alphanumerically, including Argument and Directive.
- Otherwise, elements are kept in order. For example in {north:neigh(dir:NORTH) east:neigh(dir:EAST)}, EAST should always appear after NORTH.
For example:
query Foo {
  user(id : "hello") {
    ... Baz
    timezone
    aliased: name
  }
}
fragment Baz on User {
  dob
}
becomes
query Foo{user(id:""){name timezone...Baz}}fragment Baz on User{dob}
Signatures and sensitive data
The signature algorithm is primarily designed to make it possible to treat operations that differ only in trivial ways as the same operation. It also happens that removing the content of string literalsappears to achieve greater data privacy within Graph Manager, but this is not the primary goal. In fact, Graph Manager also sends the full raw query along with traces (though it does not currently expose them in the user interface), so relying on the signature to ensure sensitive data never hits Graph Manager's servers is inappropriate.
Future versions of Graph Manager are likely to change this default algorithm to leave string literals alone, though it will still be easy to configure your server to remove string literals like in the current implementation. We also intend to stop sending the full raw query in future versions of Graph Manager, so that the signature algorithm really can be used to avoid sending sensitive data in queries to Graph Manager.
But where possible, we strongly advise that you keep sensitive data in GraphQL variables instead of in literal arguments in the query body, as you can more easily control which variables should be stripped out of the Graph Manager reporting pathway for privacy purposes.
Error tracking
Metrics reporting to Graph Manager comes with built-in error tracking for basic GraphQL errors. Graph Manager will be able to classify errors by error type, class, and message.
The errors tab in Graph Manager's metrics layer automatically shows errors aggregated across your service, and this can be filtered to errors for a specific operation using the filter panel. Each operation can have multiple requests that return errors and will list these. Each error listed that has one trace can have multiple errors under each resolver. Clicking into the trace for a request with errors will take you to details of that error instance.
Previous:
Segmenting metrics by client
Next:
Managed federation overview
- New Content published on w3resource:
- HTML-CSS Practical: Exercises, Practice, Solution
- Java Regular Expression: Exercises, Practice, Solution
- Scala Programming Exercises, Practice, Solution
- Python Itertools exercises
- Python Numpy exercises
- Python GeoPy Package exercises
- Python Pandas exercises
- Python nltk exercises
- Python BeautifulSoup exercises
- Form Template
- Composer - PHP Package Manager
- PHPUnit - PHP Testing
- Laravel - PHP Framework
- Angular - JavaScript Framework
- Vue - JavaScript Framework
- Jest - JavaScript Testing Framework