R Programming: Create a simple bar plot of five subjects marks
R Programming: Basic Exercise-21 with Solution
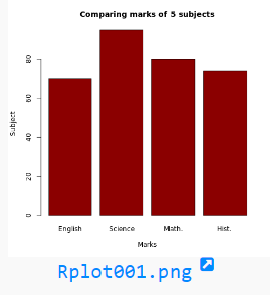
Write a R program to create a simple bar plot of five subjects marks.
Sample Solution :
R Programming Code :
marks = c(70, 95, 80, 74)
barplot(marks,
main = "Comparing marks of 5 subjects",
xlab = "Marks",
ylab = "Subject",
names.arg = c("English", "Science", "Math.", "Hist."),
col = "darkred",
horiz = FALSE)
Sample Output:
R Programming Code Editor:
Have another way to solve this solution? Contribute your code (and comments) through Disqus.
Previous: Write a R program to draw an empty plot and an empty plot specify the axes limits of the graphic.
Next: Write a R program to create bell curve of a random normal distribution.
Test your Programming skills with w3resource's quiz.
What is the difficulty level of this exercise?
- New Content published on w3resource:
- HTML-CSS Practical: Exercises, Practice, Solution
- Java Regular Expression: Exercises, Practice, Solution
- Scala Programming Exercises, Practice, Solution
- Python Itertools exercises
- Python Numpy exercises
- Python GeoPy Package exercises
- Python Pandas exercises
- Python nltk exercises
- Python BeautifulSoup exercises
- Form Template
- Composer - PHP Package Manager
- PHPUnit - PHP Testing
- Laravel - PHP Framework
- Angular - JavaScript Framework
- Vue - JavaScript Framework
- Jest - JavaScript Testing Framework