R Programming: Draw an empty plot and an empty plot specify the axes limits of the graphic
R Programming: Basic Exercise-20 with Solution
Write a R program to draw an empty plot and an empty plot specify the axes limits of the graphic.
Sample Solution :
R Programming Code :
#print("Empty plot:")
plot.new()
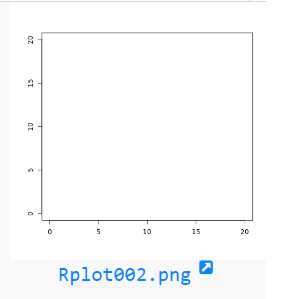
#print("Empty plot specify the axes limits of the graphic:")
plot(1, type="n", xlab="", ylab="", xlim=c(0, 20), ylim=c(0, 20))
Sample Output:
R Programming Code Editor:
Have another way to solve this solution? Contribute your code (and comments) through Disqus.
Previous: Write a R program to create a list of elements using vectors, matrices and a functions. Print the content of the list.
Next: Write a R program to create a simple bar plot of five subjects marks.
Test your Programming skills with w3resource's quiz.
What is the difficulty level of this exercise?
- New Content published on w3resource:
- HTML-CSS Practical: Exercises, Practice, Solution
- Java Regular Expression: Exercises, Practice, Solution
- Scala Programming Exercises, Practice, Solution
- Python Itertools exercises
- Python Numpy exercises
- Python GeoPy Package exercises
- Python Pandas exercises
- Python nltk exercises
- Python BeautifulSoup exercises
- Form Template
- Composer - PHP Package Manager
- PHPUnit - PHP Testing
- Laravel - PHP Framework
- Angular - JavaScript Framework
- Vue - JavaScript Framework
- Jest - JavaScript Testing Framework