Pandas: Create a horizontal stacked bar plot of one column versus other columns
Pandas: Plotting Exercise-6 with Solution
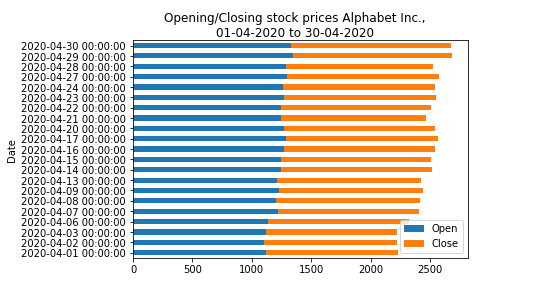
Write a Pandas program to create a horizontal stacked bar plot of opening, closing stock prices of Alphabet Inc. between two specific dates.
Use the alphabet_stock_data.csv file to extract data.
alphabet_stock_data:
alphabet_stock_data Table
| Date | Open | High | Low | Close | Adj Close | Volume |
|---|---|---|---|---|---|---|
| 2020-04-01 | 1122 | 1129.689941 | 1097.449951 | 1105.619995 | 1105.619995 | 2343100 |
| 2020-04-02 | 1098.26001 | 1126.859985 | 1096.400024 | 1120.839966 | 1120.839966 | 1964900 |
| 2020-04-03 | 1119.015015 | 1123.540039 | 1079.810059 | 1097.880005 | 1097.880005 | 2313400 |
| 2020-04-06 | 1138 | 1194.660034 | 1130.939941 | 1186.920044 | 1186.920044 | 2664700 |
| ... | ... | ... | ... | ... | ... | ... |
| ... | ... | ... | ... | ... | ... | ... |
| 2020-09-29 | 1470.390015 | 1476.662964 | 1458.805054 | 1469.329956 | 1469.329956 | 978200 |
| 2020-09-30 | 1466.800049 | 1489.75 | 1459.880005 | 1469.599976 | 1469.599976 | 1700600 |
Sample Solution:
Python Code :
import pandas as pd
import matplotlib.pyplot as plt
df = pd.read_csv("alphabet_stock_data.csv")
start_date = pd.to_datetime('2020-4-1')
end_date = pd.to_datetime('2020-4-30')
df['Date'] = pd.to_datetime(df['Date'])
new_df = (df['Date']>= start_date) & (df['Date']<= end_date)
df1 = df.loc[new_df]
df2 = df1[['Date', 'Open', 'Close']]
df3 = df2.set_index('Date')
plt.figure(figsize=(20,20))
df3.plot.barh(stacked=True)
plt.suptitle('Opening/Closing stock prices Alphabet Inc.,\n01-04-2020 to 30-04-2020', fontsize=12, color='black')
plt.show()
Sample Output:
Click for download alphabet_stock_data.csv
Python Code Editor:
Have another way to solve this solution? Contribute your code (and comments) through Disqus.
Previous: Write a Pandas program to create a stacked bar plot of opening, closing stock prices of Alphabet Inc. between two specific dates.
Next: Write a Pandas program to create a histograms plot of opening, closing, high, low stock prices of Alphabet Inc. between two specific dates.
What is the difficulty level of this exercise?
Test your Programming skills with w3resource's quiz.
Python: Tips of the Day
Find current directory and file's directory:
To get the full path to the directory a Python file is contained in, write this in that file:
import os
dir_path = os.path.dirname(os.path.realpath(__file__))
(Note that the incantation above won't work if you've already used os.chdir() to change your current working directory, since the value of the __file__ constant is relative to the current working directory and is not changed by an os.chdir() call.)
To get the current working directory use
import os
cwd = os.getcwd()
Documentation references for the modules, constants and functions used above:
- The os and os.path modules.
- The __file__ constant
- os.path.realpath(path) (returns "the canonical path of the specified filename, eliminating any symbolic links encountered in the path")
- os.path.dirname(path) (returns "the directory name of pathname path")
- os.getcwd() (returns "a string representing the current working directory")
- os.chdir(path) ("change the current working directory to path")
Ref: https://bit.ly/3fy0R6m
- New Content published on w3resource:
- HTML-CSS Practical: Exercises, Practice, Solution
- Java Regular Expression: Exercises, Practice, Solution
- Scala Programming Exercises, Practice, Solution
- Python Itertools exercises
- Python Numpy exercises
- Python GeoPy Package exercises
- Python Pandas exercises
- Python nltk exercises
- Python BeautifulSoup exercises
- Form Template
- Composer - PHP Package Manager
- PHPUnit - PHP Testing
- Laravel - PHP Framework
- Angular - JavaScript Framework
- Vue - JavaScript Framework
- Jest - JavaScript Testing Framework