Pandas: Create a plot to visualize daily percentage returns of a stock price
Pandas: Plotting Exercise-17 with Solution
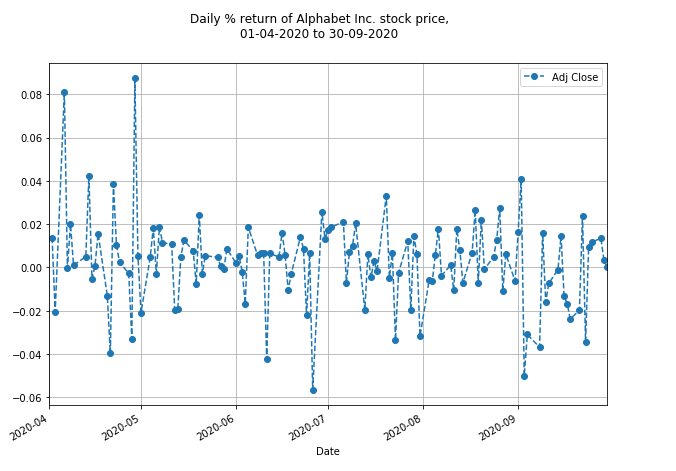
Write a Pandas program to create a plot to visualize daily percentage returns of Alphabet Inc. stock price between two specific dates.
Use the alphabet_stock_data.csv file to extract data.
alphabet_stock_data:
alphabet_stock_data Table
| Date | Open | High | Low | Close | Adj Close | Volume |
|---|---|---|---|---|---|---|
| 2020-04-01 | 1122 | 1129.689941 | 1097.449951 | 1105.619995 | 1105.619995 | 2343100 |
| 2020-04-02 | 1098.26001 | 1126.859985 | 1096.400024 | 1120.839966 | 1120.839966 | 1964900 |
| 2020-04-03 | 1119.015015 | 1123.540039 | 1079.810059 | 1097.880005 | 1097.880005 | 2313400 |
| 2020-04-06 | 1138 | 1194.660034 | 1130.939941 | 1186.920044 | 1186.920044 | 2664700 |
| ... | ... | ... | ... | ... | ... | ... |
| ... | ... | ... | ... | ... | ... | ... |
| 2020-09-29 | 1470.390015 | 1476.662964 | 1458.805054 | 1469.329956 | 1469.329956 | 978200 |
| 2020-09-30 | 1466.800049 | 1489.75 | 1459.880005 | 1469.599976 | 1469.599976 | 1700600 |
Sample Solution:
Python Code :
import pandas as pd
import matplotlib.pyplot as plt
df = pd.read_csv("alphabet_stock_data.csv")
start_date = pd.to_datetime('2020-4-1')
end_date = pd.to_datetime('2020-9-30')
df['Date'] = pd.to_datetime(df['Date'])
new_df = (df['Date']>= start_date) & (df['Date']<= end_date)
df1 = df.loc[new_df]
df2 = df1[['Date', 'Adj Close']]
df3 = df2.set_index('Date')
daily_changes = df3.pct_change(periods=1)
daily_changes['Adj Close'].plot(figsize=(10,7),legend=True,linestyle='--',marker='o')
plt.suptitle('Daily % return of Alphabet Inc. stock price,\n01-04-2020 to 30-09-2020', fontsize=12, color='black')
plt.grid(True)
plt.show()
Sample Output:
Click for download alphabet_stock_data.csv
Python Code Editor:
Have another way to solve this solution? Contribute your code (and comments) through Disqus.
Previous: Write a Pandas program to create a scatter plot of the trading volume/stock prices of Alphabet Inc. stock between two specific dates.
Next: Write a Pandas program to plot the volatility over a period of time of Alphabet Inc. stock price between two specific dates.
What is the difficulty level of this exercise?
Test your Programming skills with w3resource's quiz.
Python: Tips of the Day
Find current directory and file's directory:
To get the full path to the directory a Python file is contained in, write this in that file:
import os
dir_path = os.path.dirname(os.path.realpath(__file__))
(Note that the incantation above won't work if you've already used os.chdir() to change your current working directory, since the value of the __file__ constant is relative to the current working directory and is not changed by an os.chdir() call.)
To get the current working directory use
import os
cwd = os.getcwd()
Documentation references for the modules, constants and functions used above:
- The os and os.path modules.
- The __file__ constant
- os.path.realpath(path) (returns "the canonical path of the specified filename, eliminating any symbolic links encountered in the path")
- os.path.dirname(path) (returns "the directory name of pathname path")
- os.getcwd() (returns "a string representing the current working directory")
- os.chdir(path) ("change the current working directory to path")
Ref: https://bit.ly/3fy0R6m
- New Content published on w3resource:
- HTML-CSS Practical: Exercises, Practice, Solution
- Java Regular Expression: Exercises, Practice, Solution
- Scala Programming Exercises, Practice, Solution
- Python Itertools exercises
- Python Numpy exercises
- Python GeoPy Package exercises
- Python Pandas exercises
- Python nltk exercises
- Python BeautifulSoup exercises
- Form Template
- Composer - PHP Package Manager
- PHPUnit - PHP Testing
- Laravel - PHP Framework
- Angular - JavaScript Framework
- Vue - JavaScript Framework
- Jest - JavaScript Testing Framework