Python Scikit-learn: Create a joinplot to describe individual distributions on the same plot between Sepal length and Sepal width
Python Machine learning Iris Visualization: Exercise-7 with Solution
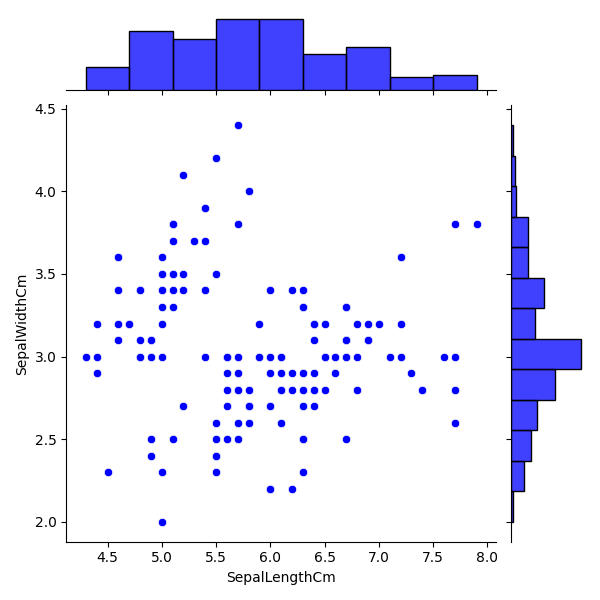
Write a Python program to create a joinplot to describe individual distributions on the same plot between Sepal length and Sepal width.
Note: joinplot - Draw a plot of two variables with bivariate and univariate graphs.
Sample Solution:
Python Code:
import pandas as pd
import seaborn as sns
import matplotlib.pyplot as plt
iris = pd.read_csv("iris.csv")
fig=sns.jointplot(x='SepalLengthCm', y='SepalWidthCm', data=iris, color='blue')
plt.show()
Sample Output:
Python Code Editor:
Have another way to solve this solution? Contribute your code (and comments) through Disqus.
Previous: Write a Python program to create a graph to see how the length and width of SepalLength, SepalWidth, PetalLength, PetalWidth are distributed.
Next: Write a Python program to create a joinplot using “hexbin” to describe individual distributions on the same plot between Sepal length and Sepal width.
What is the difficulty level of this exercise?
- New Content published on w3resource:
- HTML-CSS Practical: Exercises, Practice, Solution
- Java Regular Expression: Exercises, Practice, Solution
- Scala Programming Exercises, Practice, Solution
- Python Itertools exercises
- Python Numpy exercises
- Python GeoPy Package exercises
- Python Pandas exercises
- Python nltk exercises
- Python BeautifulSoup exercises
- Form Template
- Composer - PHP Package Manager
- PHPUnit - PHP Testing
- Laravel - PHP Framework
- Angular - JavaScript Framework
- Vue - JavaScript Framework
- Jest - JavaScript Testing Framework