Python Scikit-learn: Create a graph to find relationship between the petal length and width
Python Machine learning Iris Visualization: Exercise-5 with Solution
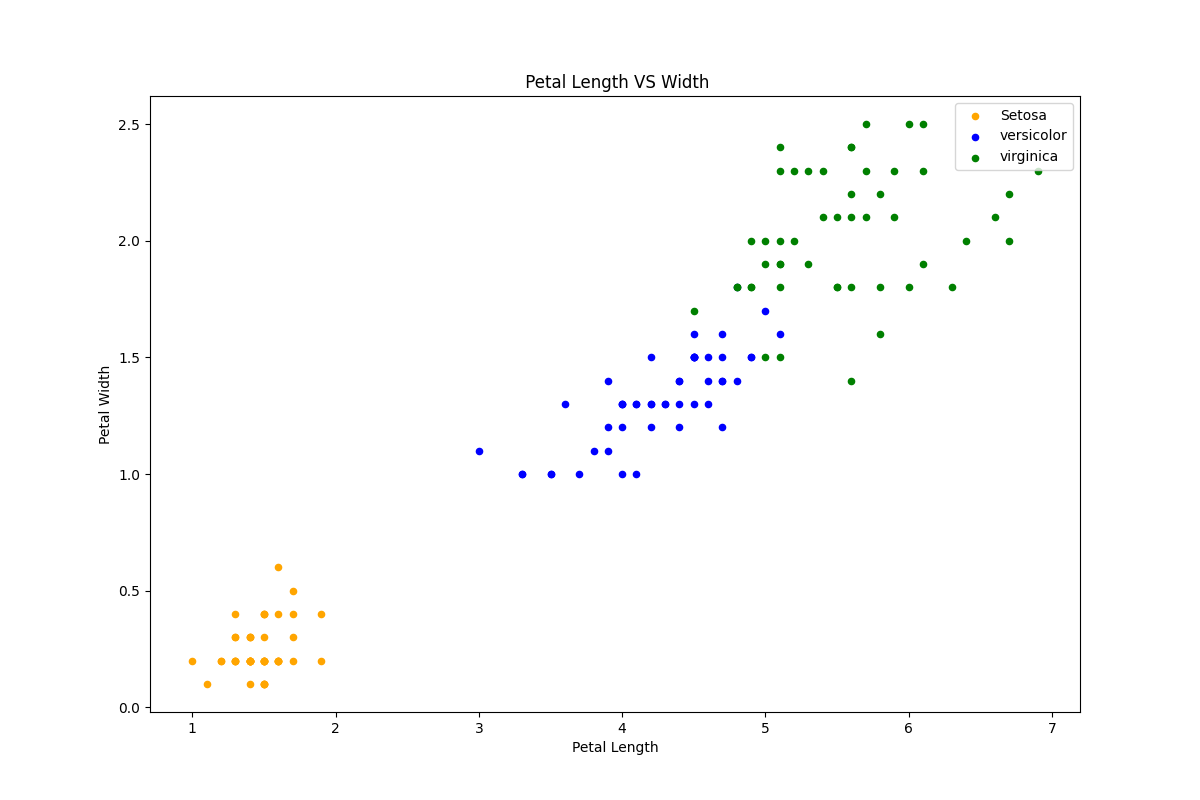
Write a Python program to create a graph to find relationship between the petal length and width.
Sample Solution:
Python Code:
import pandas as pd
import matplotlib.pyplot as plt
iris = pd.read_csv("iris.csv")
fig = iris[iris.Species=='Iris-setosa'].plot.scatter(x='PetalLengthCm',y='PetalWidthCm',color='orange', label='Setosa')
iris[iris.Species=='Iris-versicolor'].plot.scatter(x='PetalLengthCm',y='PetalWidthCm',color='blue', label='versicolor',ax=fig)
iris[iris.Species=='Iris-virginica'].plot.scatter(x='PetalLengthCm',y='PetalWidthCm',color='green', label='virginica', ax=fig)
fig.set_xlabel("Petal Length")
fig.set_ylabel("Petal Width")
fig.set_title(" Petal Length VS Width")
fig=plt.gcf()
fig.set_size_inches(12,8)
plt.show()
Sample Output:
Python Code Editor:
Have another way to solve this solution? Contribute your code (and comments) through Disqus.
Previous: Write a Python program to create a Pie plot to get the frequency of the three species of the Iris data.
Next: Write a Python program to create a graph to see how the length and width of SepalLength, SepalWidth, PetalLength, PetalWidth are distributed.
What is the difficulty level of this exercise?
- New Content published on w3resource:
- HTML-CSS Practical: Exercises, Practice, Solution
- Java Regular Expression: Exercises, Practice, Solution
- Scala Programming Exercises, Practice, Solution
- Python Itertools exercises
- Python Numpy exercises
- Python GeoPy Package exercises
- Python Pandas exercises
- Python nltk exercises
- Python BeautifulSoup exercises
- Form Template
- Composer - PHP Package Manager
- PHPUnit - PHP Testing
- Laravel - PHP Framework
- Angular - JavaScript Framework
- Vue - JavaScript Framework
- Jest - JavaScript Testing Framework