Python Scikit-learn: Create a Pie plot to get the frequency of the three species of the Iris data
Python Machine learning Iris Visualization: Exercise-3 with Solution
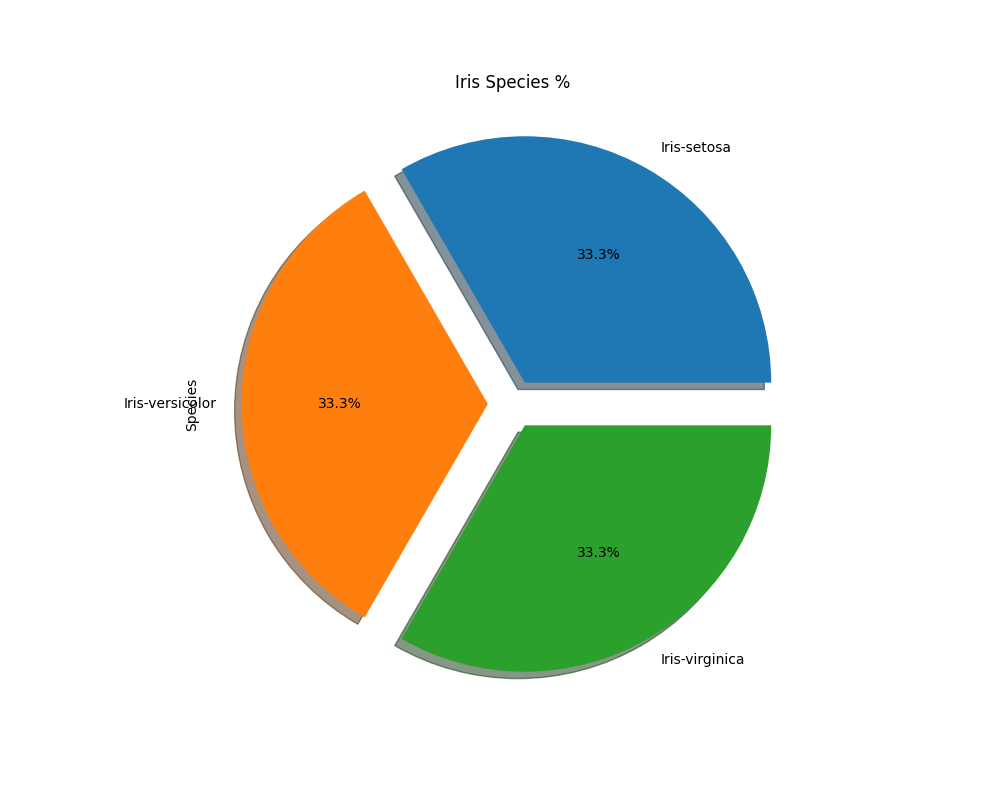
Write a Python program to create a Pie plot to get the frequency of the three species of the Iris data.
Sample Solution:
Python Code:
import pandas as pd
import matplotlib.pyplot as plt
iris = pd.read_csv("iris.csv")
ax=plt.subplots(1,1,figsize=(10,8))
iris['Species'].value_counts().plot.pie(explode=[0.1,0.1,0.1],autopct='%1.1f%%',shadow=True,figsize=(10,8))
plt.title("Iris Species %")
plt.show()
Sample Output:
Python Code Editor:
Have another way to solve this solution? Contribute your code (and comments) through Disqus.
Previous: Write a Python program to create a Bar plot to get the frequency of the three species of the Iris data.
Next: Write a Python program to create a graph to find relationship between the sepal length and width.
What is the difficulty level of this exercise?
- New Content published on w3resource:
- HTML-CSS Practical: Exercises, Practice, Solution
- Java Regular Expression: Exercises, Practice, Solution
- Scala Programming Exercises, Practice, Solution
- Python Itertools exercises
- Python Numpy exercises
- Python GeoPy Package exercises
- Python Pandas exercises
- Python nltk exercises
- Python BeautifulSoup exercises
- Form Template
- Composer - PHP Package Manager
- PHPUnit - PHP Testing
- Laravel - PHP Framework
- Angular - JavaScript Framework
- Vue - JavaScript Framework
- Jest - JavaScript Testing Framework