Python Scikit-learn: Create a plot to get a general Statistics of Iris data
Python Machine learning Iris Visualization: Exercise-1 with Solution
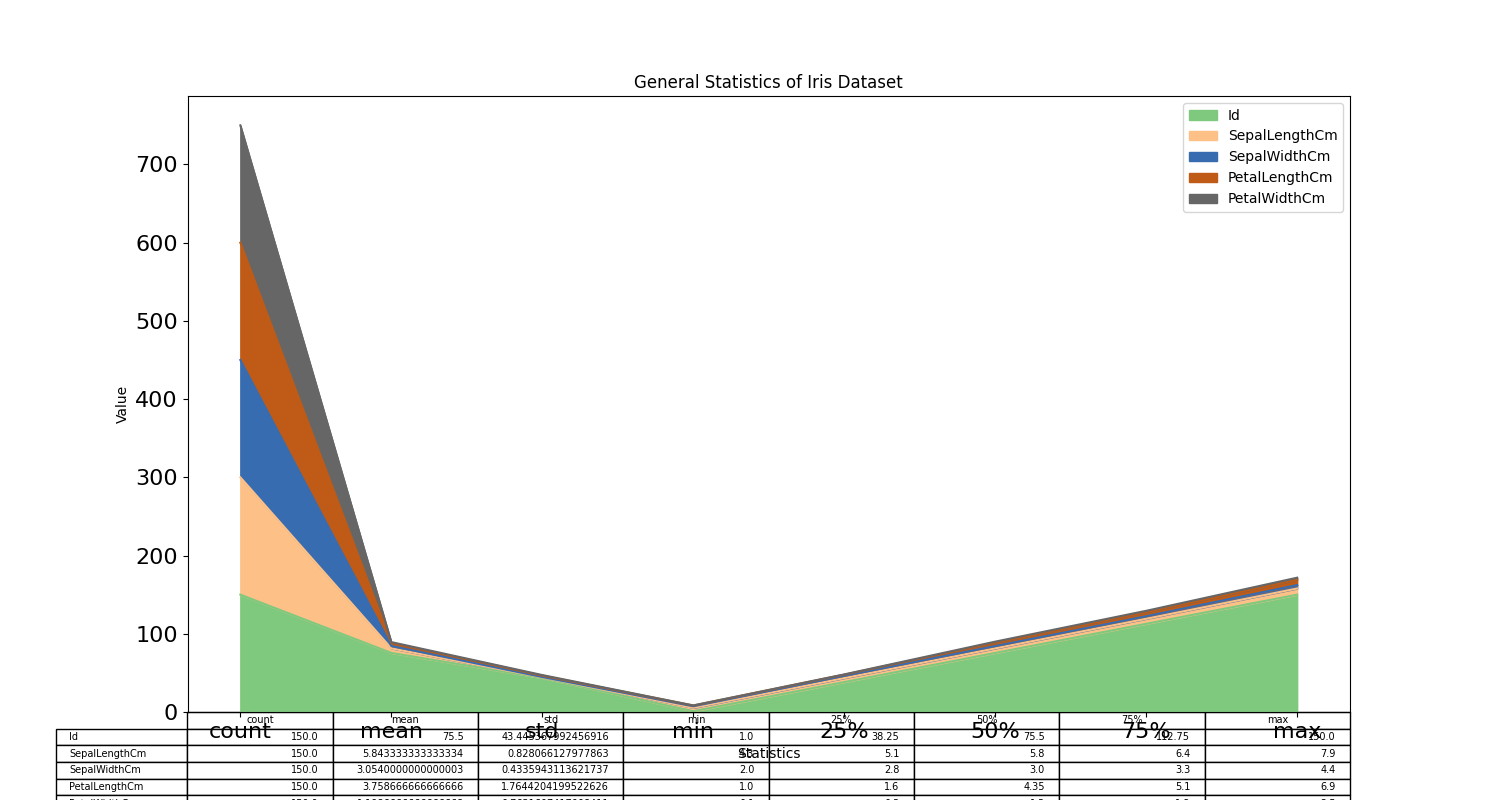
Write a Python program to create a plot to get a general Statistics of Iris data.
Sample Solution:
Python Code:
import pandas as pd
import matplotlib.pyplot as plt
iris = pd.read_csv("iris.csv")
iris.describe().plot(kind = "area",fontsize=16, figsize = (15,8), table = True, colormap="Accent")
plt.xlabel('Statistics',)
plt.ylabel('Value')
plt.title("General Statistics of Iris Dataset")
plt.show()
Sample Output:
Python Code Editor:
Have another way to solve this solution? Contribute your code (and comments) through Disqus.
Previous: Python Machine learning Iris Basic Exercises Home.
Next: Write a Python program to create a Bar plot to get the frequency of the three species of the Iris data.
What is the difficulty level of this exercise?
- New Content published on w3resource:
- HTML-CSS Practical: Exercises, Practice, Solution
- Java Regular Expression: Exercises, Practice, Solution
- Scala Programming Exercises, Practice, Solution
- Python Itertools exercises
- Python Numpy exercises
- Python GeoPy Package exercises
- Python Pandas exercises
- Python nltk exercises
- Python BeautifulSoup exercises
- Form Template
- Composer - PHP Package Manager
- PHPUnit - PHP Testing
- Laravel - PHP Framework
- Angular - JavaScript Framework
- Vue - JavaScript Framework
- Jest - JavaScript Testing Framework