Matplotlib Scatter: Draw a scatter plot with empty circles taking a random distribution in X and Y
Matplotlib Scatter: Exercise-2 with Solution
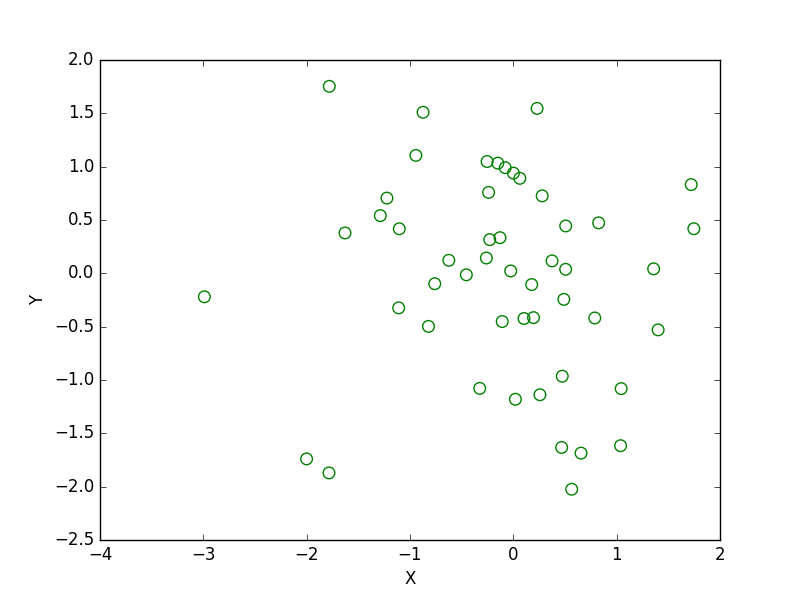
Write a Python program to draw a scatter plot with empty circles taking a random distribution in X and Y and plotted against each other.
Sample Solution:
Python Code:
import matplotlib.pyplot as plt
import numpy as np
x = np.random.randn(50)
y = np.random.randn(50)
plt.scatter(x, y, s=70, facecolors='none', edgecolors='g')
plt.xlabel("X")
plt.ylabel("Y")
plt.show()
Sample Output:
Python Code Editor:
Contribute your code and comments through Disqus.:
Previous: Write a Python program to draw a scatter graph taking a random distribution in X and Y and plotted against each other.
Next: Write a Python program to draw a scatter plot using random distributions to generate balls of different sizes.
What is the difficulty level of this exercise?
- New Content published on w3resource:
- HTML-CSS Practical: Exercises, Practice, Solution
- Java Regular Expression: Exercises, Practice, Solution
- Scala Programming Exercises, Practice, Solution
- Python Itertools exercises
- Python Numpy exercises
- Python GeoPy Package exercises
- Python Pandas exercises
- Python nltk exercises
- Python BeautifulSoup exercises
- Form Template
- Composer - PHP Package Manager
- PHPUnit - PHP Testing
- Laravel - PHP Framework
- Angular - JavaScript Framework
- Vue - JavaScript Framework
- Jest - JavaScript Testing Framework