Matplotlib Bar Chart: Create a stacked bar plot with error bars
Matplotlib Bar Chart: Exercise-14 with Solution
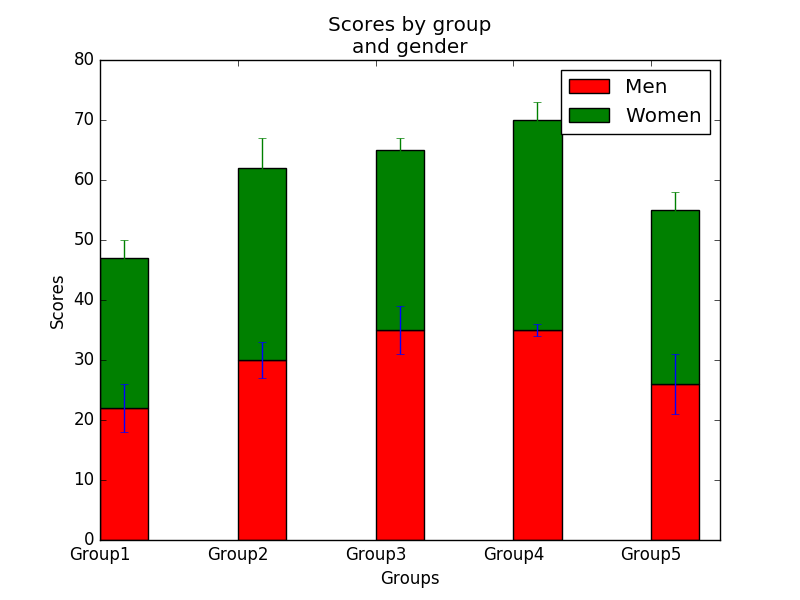
Write a Python program to create a stacked bar plot with error bars.
Note: Use bottom to stack the women’s bars on top of the men’s bars.
Sample Data:
Means (men) = (22, 30, 35, 35, 26)
Means (women) = (25, 32, 30, 35, 29)
Men Standard deviation = (4, 3, 4, 1, 5)
Women Standard deviation = (3, 5, 2, 3, 3)
Sample Solution:
Python Code:
import numpy as np
import matplotlib.pyplot as plt

N = 5
menMeans = (22, 30, 35, 35, 26)
womenMeans = (25, 32, 30, 35, 29)
menStd = (4, 3, 4, 1, 5)
womenStd = (3, 5, 2, 3, 3)
# the x locations for the groups
ind = np.arange(N)
# the width of the bars
width = 0.35

p1 = plt.bar(ind, menMeans, width, yerr=menStd, color='red')
p2 = plt.bar(ind, womenMeans, width,
bottom=menMeans, yerr=womenStd, color='green')

plt.ylabel('Scores')
plt.xlabel('Groups')
plt.title('Scores by group\n' + 'and gender')
plt.xticks(ind, ('Group1', 'Group2', 'Group3', 'Group4', 'Group5'))
plt.yticks(np.arange(0, 81, 10))
plt.legend((p1[0], p2[0]), ('Men', 'Women'))

plt.show()
Sample Output:
Python Code Editor:
Contribute your code and comments through Disqus.
Previous: Write a Python program to create bar plots with errorbars on the same figure. Attach a text label above each bar displaying men means (integer value).
Next: Write a Python program to create a horizontal bar chart with differently ordered colors.
What is the difficulty level of this exercise?
- New Content published on w3resource:
- HTML-CSS Practical: Exercises, Practice, Solution
- Java Regular Expression: Exercises, Practice, Solution
- Scala Programming Exercises, Practice, Solution
- Python Itertools exercises
- Python Numpy exercises
- Python GeoPy Package exercises
- Python Pandas exercises
- Python nltk exercises
- Python BeautifulSoup exercises
- Form Template
- Composer - PHP Package Manager
- PHPUnit - PHP Testing
- Laravel - PHP Framework
- Angular - JavaScript Framework
- Vue - JavaScript Framework
- Jest - JavaScript Testing Framework